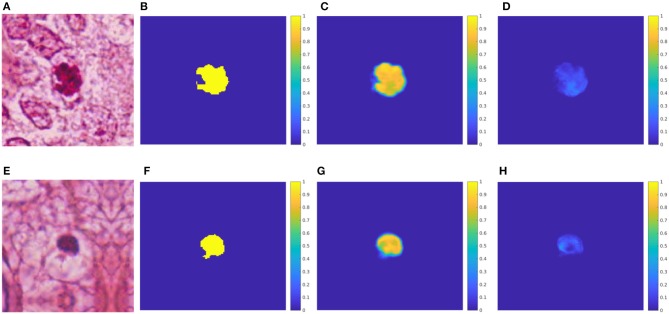
Figure 5.
U-net: Probability maps for both predicted classes in the testing-patch dataset. (A) HPF patch #35 with a mitosis. (B) GT mask of the mitosis. (C) Predicted mask for the mitosis class. (D) Predicted mask for the non-mitosis class. (E) HPF patch #128 with a non-mitotic cell. (F) GT mask of the non-mitosis. (G) Predicted mask for the non-mitosis class. (H) Predicted mask for the mitosis class.

