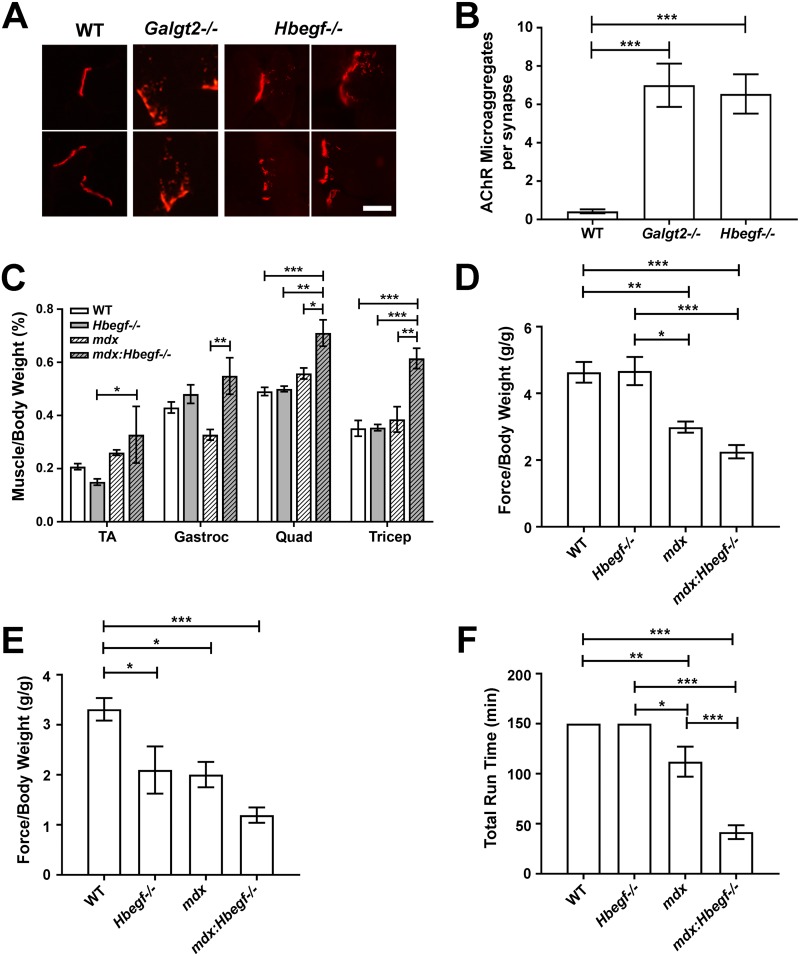
FIG 8.
Hbegf−/− mice exhibit Galgt2−/− neuromuscular junction and muscle phenotypes. (A) Examples of increased AChR microaggregates at neuromuscular junctions in Galgt2−/− (2 panels) and Hbegf−/− (4 panels) muscles compared to levels for the wild type (2 panels). Tibilais anterior muscle is shown at 3 months of age for Galgt2−/− muscle and at 7 months of age for Hbegf−/− and WT muscle. Scale bar is 10 μm. (B) Quantification of AChR microaggregates in WT, Galgt2−/−, and Hbegf−/− muscle. WT (n = 45) and Hbegf−/− (n = 75) TA muscles were from 7-month-old mice, while Galgt2−/− (n = 37) TA muscles were from 3-month-old mice. Data are means ± SEM. ***, P < 0.001 by one-way ANOVA. (C) Mouse skeletal muscle weights were normalized to total body mass. Abbreviations: TA, tibialis anterior; Gastroc, gastrocnemius; Quad, quadriceps. (D to F) Mice participated in a week-long test of strength and endurance via forelimb grip strength (D), hindlimb grip strength (E), and total run time on a treadmill (F). For panels D and E, force is normalized to body weight in each animal. For panels D to F, data are means ± SEM for n = 6 (WT), n = 4 (mdx and mdx::Hbegf−/−), and n = 3 (Hbegf−/−) measures. *, P < 0.05; **, P < 0.01; ***, P < 0.001 by one-way ANOVA.

