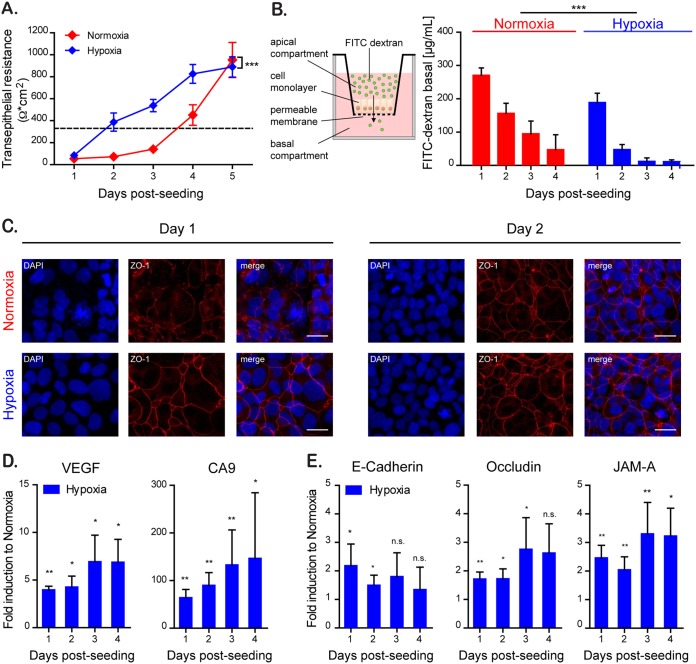
FIG 1.
Hypoxia improves barrier function in intestinal epithelial cells. T84 cells were seeded onto Transwell inserts and cultured for the indicated time under normoxic (21% O2) (red) or hypoxic conditions (1% O2) (blue). (A) The rate of TEER increase over the cell monolayer was measured every 24 h using the EVOM2 chopstick electrode. A TEER of >330 Ω ⋅ cm2 indicates complete barrier formation and is marked by a dotted line (36). (B) Paracellular permeability of the cell monolayer on Transwell inserts was assessed by adding 4-kDa FITC-dextran to the apical compartment (schematic overview [left panel]). At 3 h postincubation, the basal medium was analyzed for an increase of fluorescence by spectrofluorimetry (right panel). (C) T84 cells cultured for 24 and 48 h under normoxic and hypoxic conditions were evaluated for the expression of the tight junction protein ZO-1 (red). Cell nuclei were stained with DAPI (blue). Scale bar, 25 μm. A representative image is shown. (D) RNA samples of normoxic and hypoxic cultures of T84 cells taken at 24-h intervals for 4 days were analyzed by qPCR for the expression of the hypoxia-induced VEGF and CA9 genes. The results are normalized to normoxic values for each day. (E) RNA samples of normoxic and hypoxic cultures of T84 cells were analyzed over time by qPCR for the expression of the tight junction proteins E-cadherin, occludin, and JAM-A. The results are normalized to normoxic values for each day. (A and B) Values shown represent means ± the standard errors of the mean (SEM) (n = 9) from triplicate experiments. ***, P < 0.0001 (two-way analysis of variance [ANOVA]). (D and E) Experiments were performed in quadruplicate. Error bars indicate the standard deviations (SD). *, P < 0.05; **, < 0.01; n.s., not significant (one-sample t test on log-transformed fold changes).

