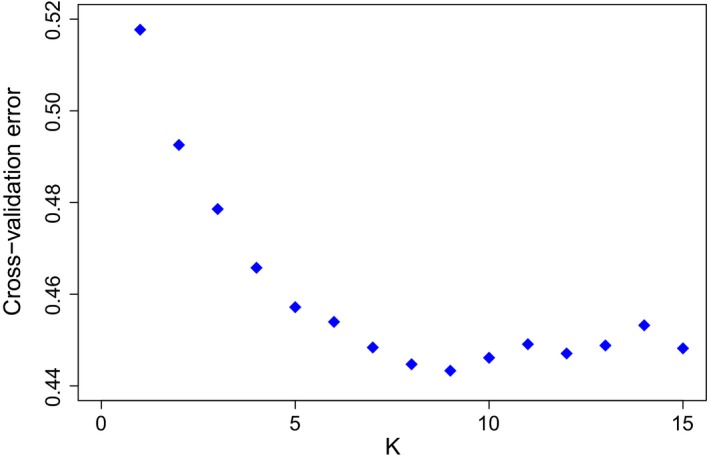
Figure 3.

ADMIXTURE analyses of cattle with cross‐validation (CV) error plot for K‐values from 2 to 9 with 195 individuals and 88,190 single nucleotide polymorphism loci. The CV error is markedly reduced with each increase in K until K = 5. Hereafter it declines more slowly towards the minimal value at K = 9. Increases in K beyond this level are not supported
