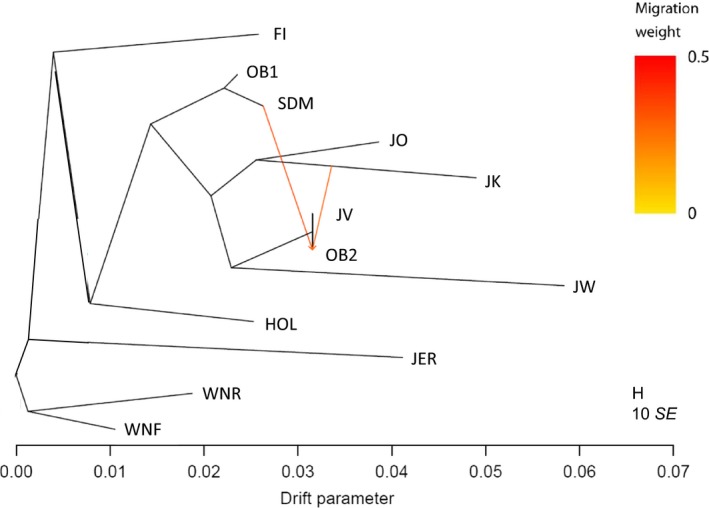
Figure 5.

Maximum‐likelihood tree for 12 cattle populations with 195 individuals and 595,025 SNPs pruned for minor allele frequency of 1% and genotyping success of 98%. The scale bar on the horizontal axis shows 10× the average standard error of the sample covariance matrix, and the length of horizontal branches is proportional to the amount of genetic drift the populations have experienced. Cattle breeds/lineages are as follows: FI: Faroe Island cattle; HOL: Holstein; JER: Jersey; JK: Jutland cattle Kortegaard‐lineage; JO: Jutland cattle Oregaard‐lineage; JV: Jutland cattle Vesterbølle‐lineage; JW: Jutland cattle Westergaard‐lineage; OB1: old bulls pre‐1980 (cryopreserved semen samples from SDM‐1965 cattle); OB2: old bulls post‐1980 (cryopreserved from n = 14 Jutland and n = 4 SDM‐1965 cattle); SDM: SDM‐1965 cattle; WNF: Western Norwegian Fjord cattle; WNR: Western Norwegian Red‐polled cattle. Migration arrows are coloured according to their weight and indicate admixture between old bulls post‐1980 and Kortegaard, as well as between old bulls post‐1980 and SDM‐1965
