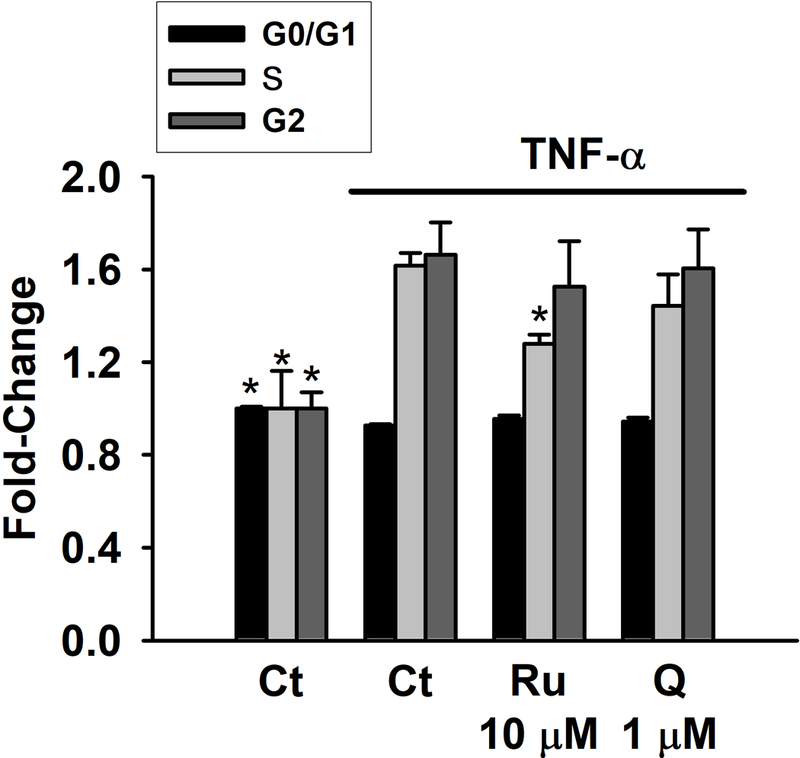
Figure 5.

Analysis of the cell cycle in myofibroblasts CCD-18Co co-stimulated with TNF-α (20 ng/mL) and rutin (Ru) or quercetin (Q) for 48 h. Cells in exponential phase were treated with the 10 μM Ru or 1 μM Q in the presence of TNF-α (20 ng/mL). Control cells (Ct) were treated in parallel with equivalent volume of DMSO (0.5% v/v). Values are expressed as fold-change (mean ± SD) of G0/G1, S, and G2 phases observed in control cells (set as 1.0). * (p < 0.05) indicates statistically significant differences from TNF-α-treated cells.
