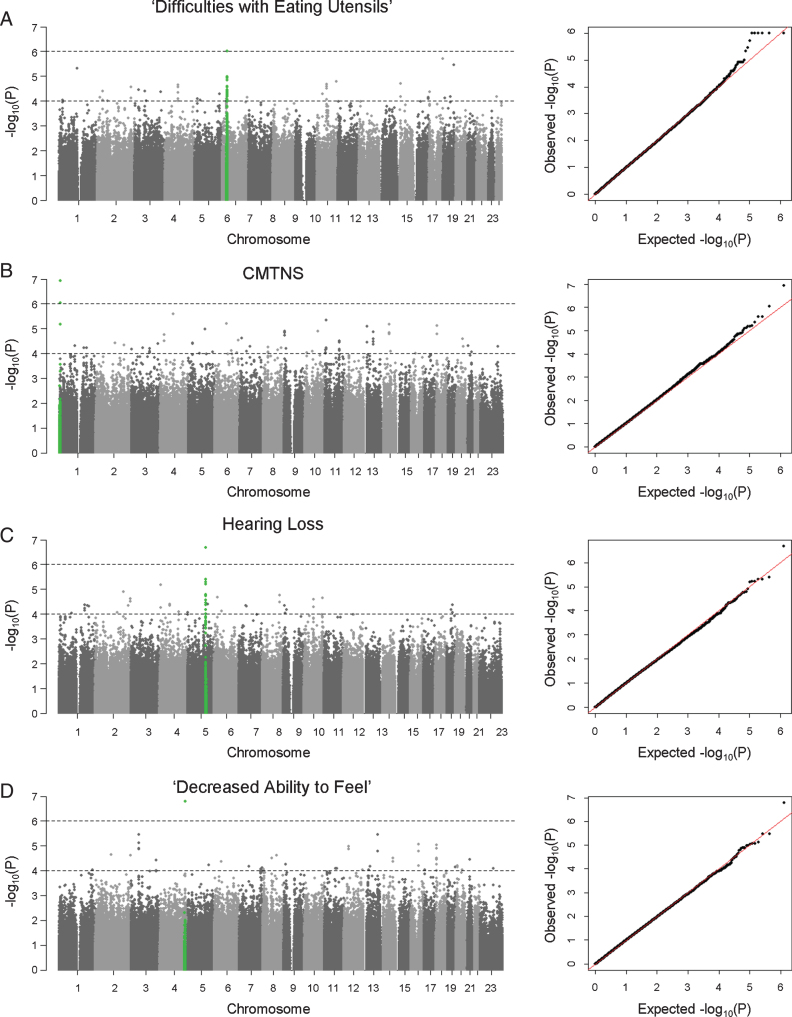
Fig. 1.
Manhattan plots and QQ plots of genome-wide association analyses. Results of (A) ‘difficulties with eating utensils’, (B) CMTNS, (C) hearing loss, (D) ‘decreased ability to feel’ in the European population are shown. Association peaks (100–kb around the lead SNPs) are highlighted in green. The dashed lines show the suggestive significance thresholds at P = 1×10⁻⁶ and P = 1×10⁻⁴.

