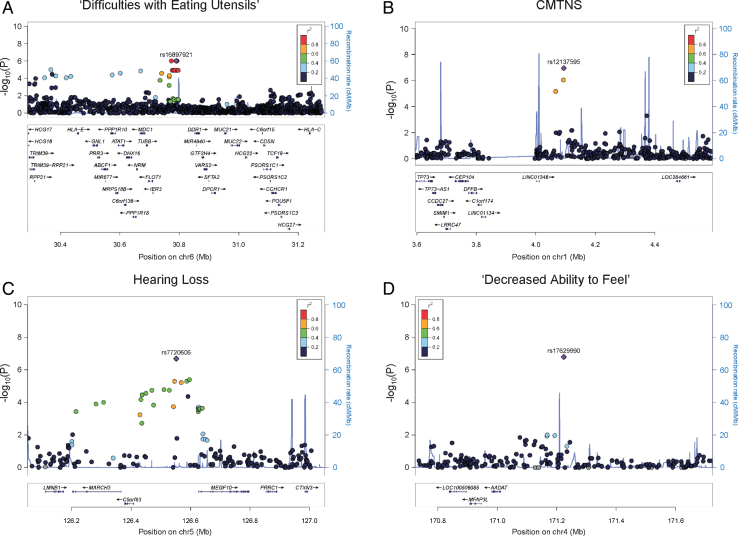
Fig. 2.
Regional association plots.Results of (A) ‘difficulties with eating utensils’, (B) CMTNS, (C) hearing loss, (D) ‘decreased ability to feel’ in the European population are shown. The purple dots show the most significantly associated SNPs. The color scheme shows R2 values of the top SNPs with other SNPs (1000 Genomes Project, Nov 2014, EUR).

