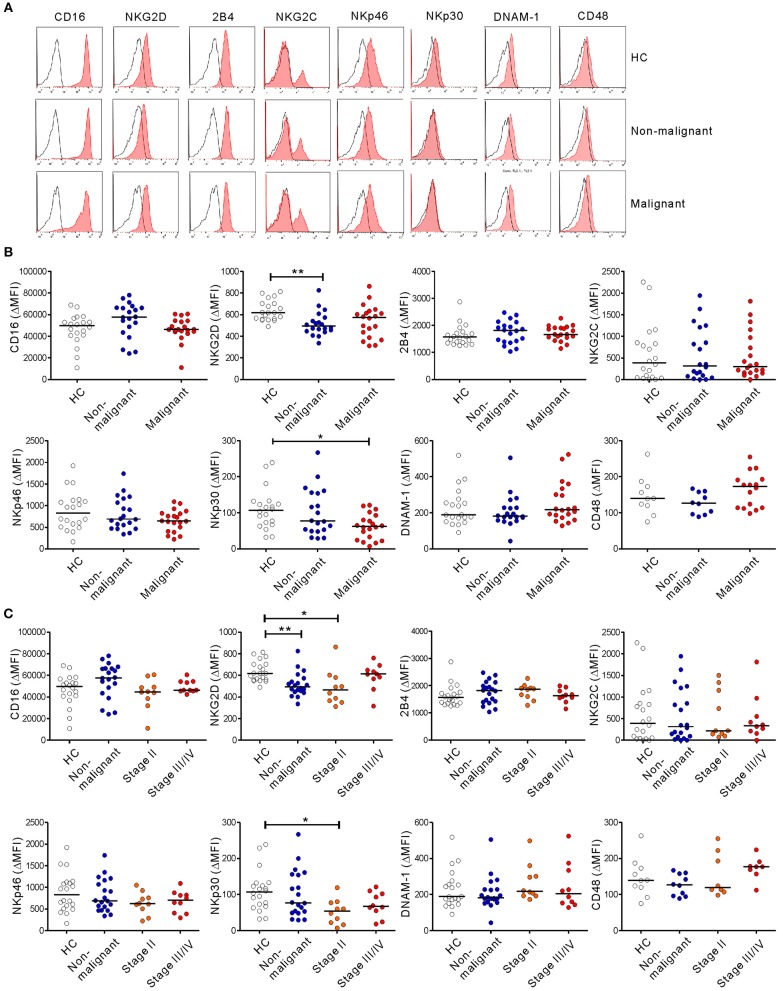
Figure 4.
PC patients have altered expression of NK cell-activating receptors. (A) Representative FACS profiles showing the expression of CD16, NKG2D, 2B4, NKG2C, NKp46, NKp30, DNAM-1, and CD48 (red shaded histograms) on gated NK cells in the healthy control (HC) group, the non-malignant group, and the malignant group. The solid lines indicate isotype control staining. (B) The mean fluorescence intensity (MFI) of the expression of each indicated receptor on NK cells is shown relative to the MFI of the isotype control (ΔMFI) in the HC group (n = 20), the non-malignant group (n = 20), and the malignant group (n = 20). (C) The MFI of the expression of each indicated receptor on NK cells relative to the MFI of its isotype control (ΔMFI) in the HC group (n = 20), the non-malignant group (n = 20), the stage II subgroup (n = 10), and the stage III/IV subgroup (n = 10). Horizontal bars indicate the medians. *P < 0.05 and **P < 0.01; Kruskal-Wallis test.

