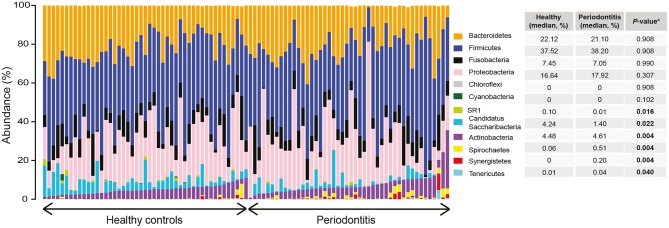
Figure 1.
Relative abundance distribution at phylum level of saliva samples from periodontitis patients and healthy controls. The bar plots depict the relative abundance of microbiota at phylum level for all samples, grouped according to their disease status (periodontitis or healthy). The median relative abundance of each phylum in saliva, in samples from patients with periodontitis and healthy controls, are also demonstrated together with the adjusted P-value. Significantly (adjusted P < 0.05) different levels are indicated with boldface.

