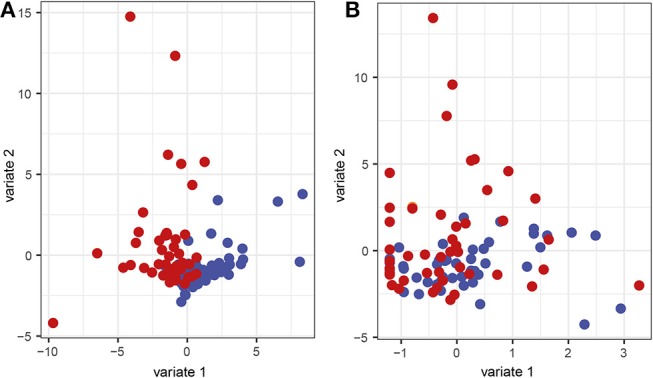
Figure 6.

Sparse partial least squares discriminant analysis (sPLS-DA) sample representation. Samples are demonstrated regarding the first and second component based on (A) the microbial and (B) the cytokine data. Red represents saliva samples from patients with periodontitis and blue represents samples from healthy controls.
