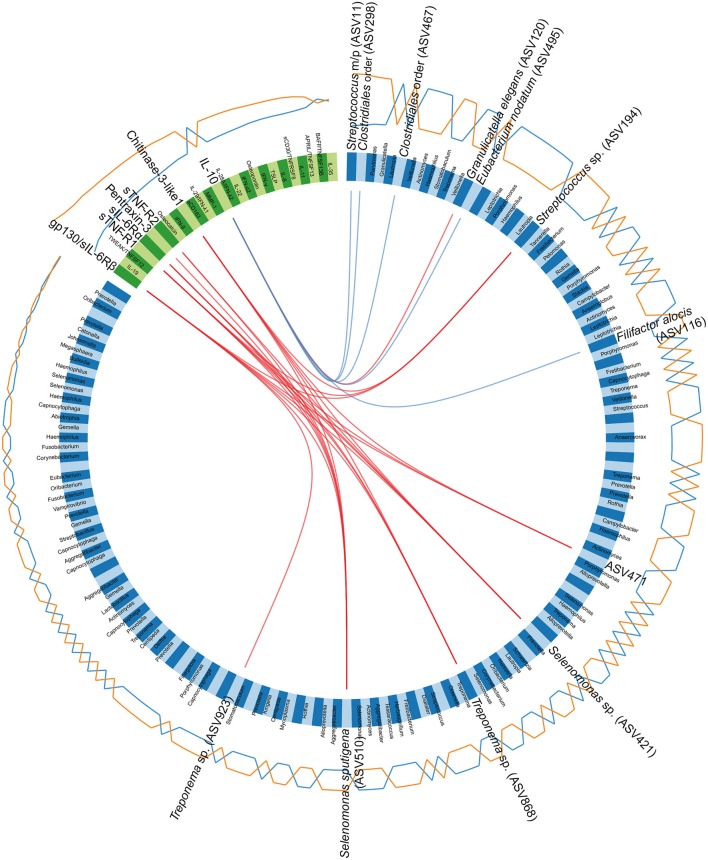
Figure 7.
Circos plot depicting correlations between microbiota and cytokines. The panel of amplicon sequence variants (ASVs) and cytokines identified by the sparse partial least squares discriminant analysis (sPLS-DA), regarding the first and second component, are included in the Circos plot. Blue variables represent ASVs and green variables represent cytokines. Orange and blue lines outside the circle represent the abundance of ASVs or the levels of cytokines in samples from patients with periodontitis and healthy controls, respectively. Red and blue lines inside the circle represent positive and negative correlations, respectively, between ASVs and cytokines, at a correlation cutoff of 0.5. The lowest annotated taxonomic rank is shown for each ASV that has a significant correlation with a cytokine, together with its ASV ID used in the analyses. Streptococcus mitis/parasanguinis is shortened to Streptococcus m/p (ASV11).

