Figure 3.

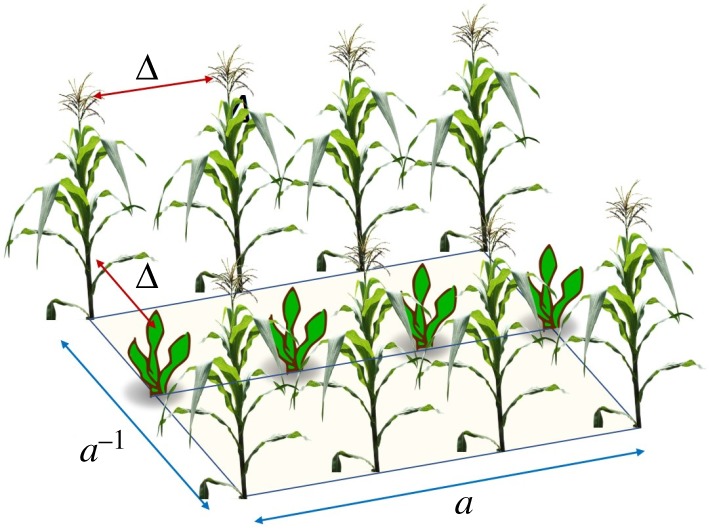
Schematic of the intercropping of two species in a rectangular plot of unit area and largest edge length a. The separation between plants is given by Δ. (Online version in colour.)

Schematic of the intercropping of two species in a rectangular plot of unit area and largest edge length a. The separation between plants is given by Δ. (Online version in colour.)