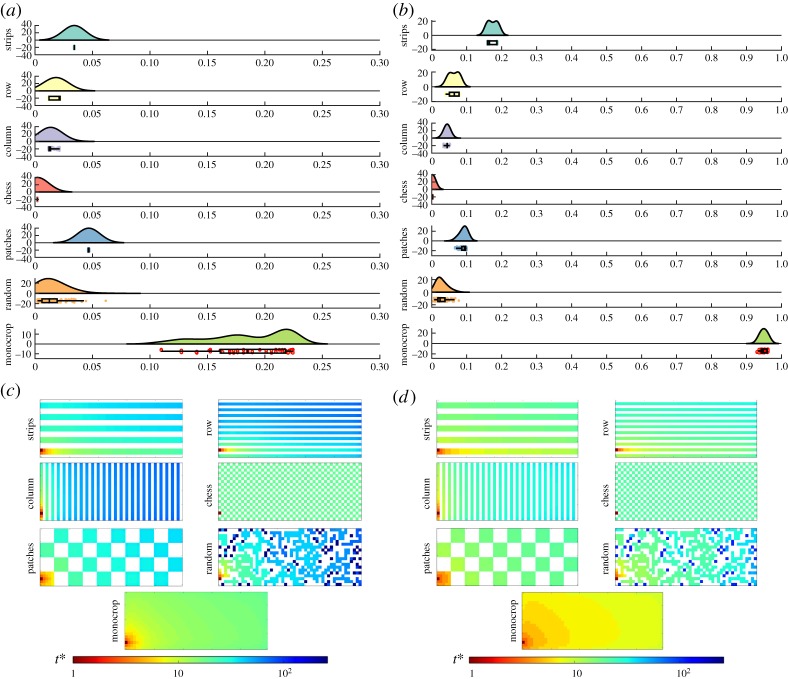
Figure 7.
Aphid-borne virus propagation on intercropped fields with trap crops. Results of the simulations for SIR epidemics at t = 10 with r = Δ, β = 0.5, μ = 0.5 for different intercropping strategies with trap crops of strength γ = 2.0. Raincloud plots of the proportion of dead plants for a viral infection propagated by aphids: (a) aphid with reduced mobility (s = 4.0) and (b) with greater mobility (s = 2.5). The clouds show the kernel distribution of the proportion of dead plants for different realizations of the epidemics. Below, the raw data are plotted (the rain) together with their corresponding box and whisker plots. Illustration of the evolution of infection across fields with different intercropping systems: (c) aphid with reduced mobility (s = 4.0) and (d) with greater mobility (s = 2.5). In both panels, the time t* is given in a colour scale (see text), and the propagation is initialized by infecting the plant in the bottom-left corner of the plot. (Online version in colour.)

