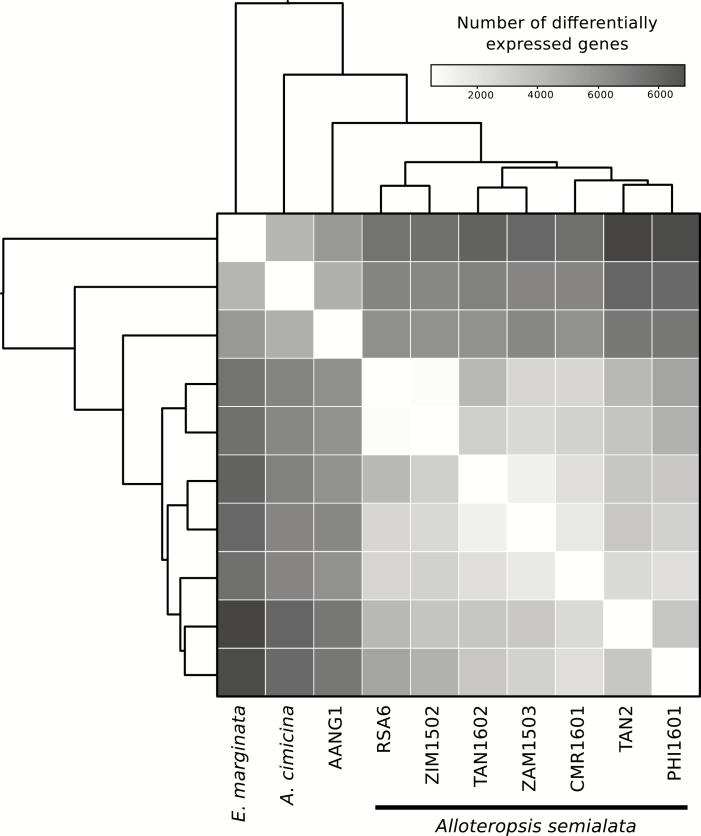
Fig. 3.
Number of differentially expressed genes among pairs of populations. The heatmap shows the number of significantly differentially expressed genes detected for each pair of populations. The phylogenetic relationships among populations are indicated on the side, using an ultrametric version of the tree presented in Fig. 1.

