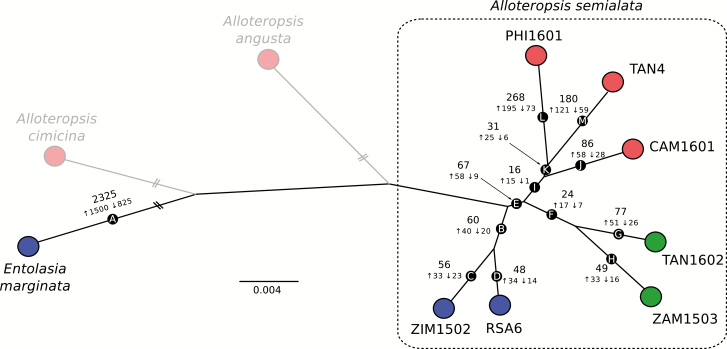
Fig. 4.
Phylogenetic patterns of changes in gene expression. The maximum-likelihood phylogeny from Fig. 1 is shown unrooted after pruning the populations not used for expression analyses. For each branch, the number of differentially expressed genes is indicated, with numbers next to arrows indicating those that are consistently up- or down-regulated as one moves along the tree from the outgroup Entolasia marginata. Each population has three biological replicates, and colors indicate the photosynthetic type (blue=C3; green=C3+C4; red=C4). The scale indicates number of nucleotide substitutions per site, with truncated branches highlighted by two bars. The two grayed out C4 congeners were excluded from these analyses, and results that involve them can be found in Supplementary Fig. S3.

