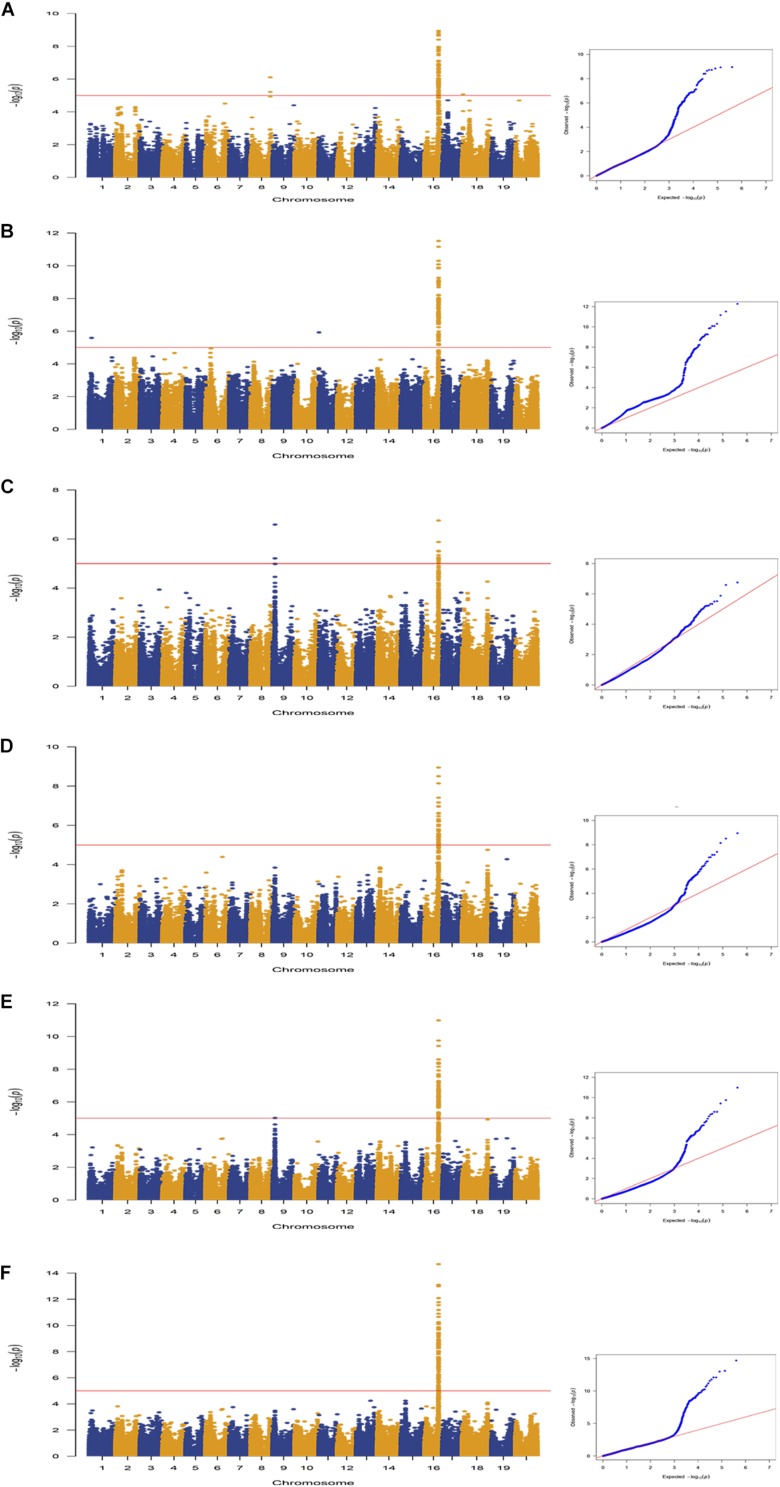
FIGURE 2.
Genome-wide association study of pod dehiscence in association panel using the MLM (Q + K) model across multiple environments. Manhattan plots and Q–Q plots for pod dehiscence in the following environments: (A) Env1; (B) Env2; (C) Env3; (D) Env4; (E) Env5; and (F) BLUP. The horizontal line depicts the significance threshold when FDR = 0.05.

