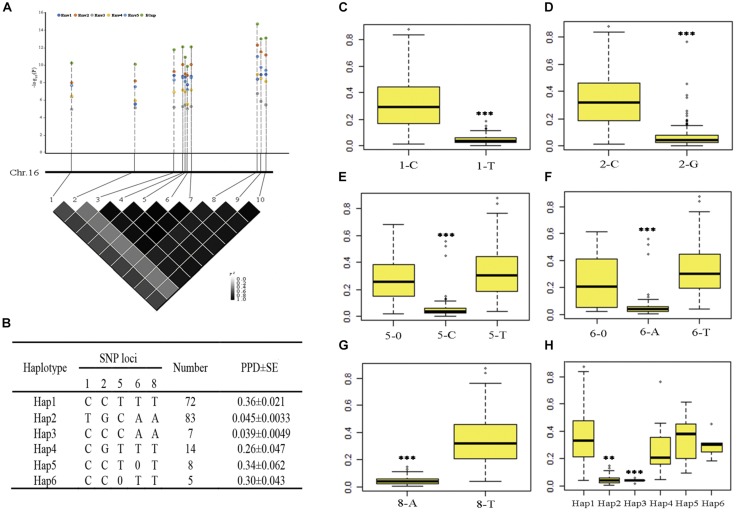
FIGURE 3.
Haplotype analysis of ten SNPs significantly associated with pod dehiscence in five environments and the PPD phenotype of five significant SNPs. (A) The physical locations of 10 SNPs and the LD plot based on pairwise R2-values between these SNPs. The color bar was used to indicate the R2-values. (B) Haplotypes observed in the association panel using the 10 SNPs; 0 indicates a base deletion. (C–G) The PPD phenotype of five significant SNPs. (H) Comparison of PPD among the haplotypes Hap1, Hap2, Hap3, Hap5, and Hap6. ∗∗∗Significant at P < 0.001. Two tail t-test was used for statistical analysis. 1–10 represent the SNPs AX-93853844, AX-94151086, AX-93853870, AX-93853873, AX-93853874, AX-94151101, AX-93853876, AX-93853895, AX-93853896, and AX-94151124; SE, standard error.

