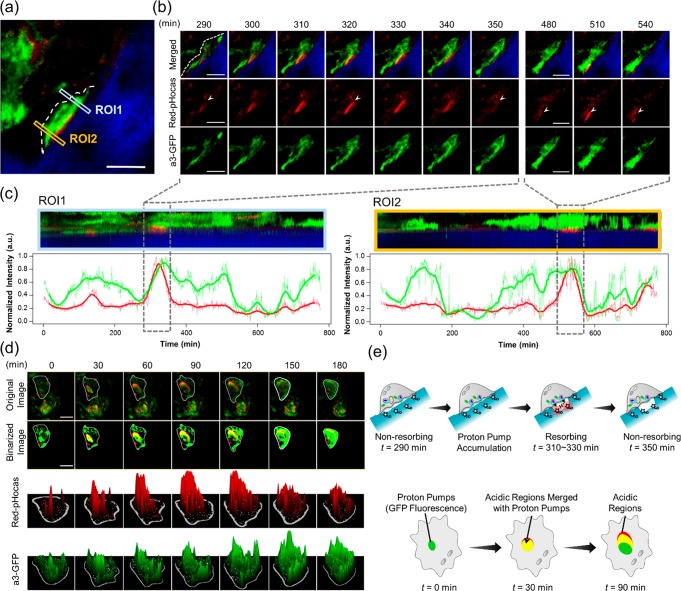
Figure 3.
Correlation analysis of osteoclast proton pumps and acidic regions on the bone surface. (a) Intravital two-photon fluorescence imaging of bone tissue after injection of Red-pHocas at the interval of 1 min. Squares indicate the region of interest (ROI). (b) Time-lapse two-photon fluorescence imaging of osteoclasts in bone tissues captured at 290–350 and 480–540 min. A white dash line and arrowheads indicate cell border and acidic regions, respectively. (c) Kymographs of fluorescence intensity of Red-pHocas (red) and a3-GFP (green) in ROI 1 (left) and ROI 2 (right) of part a. Each kymograph corresponds to the area marked by a rectangle in part a. The vertical axis corresponds the direction from the bone tissue to the cavity, and the horizontal axis indicates a lapse of time. The line charts under the kymographs present the mean intensities of Red-pHocas and a3-GFP (each bold line is the time-smoothed mean intensity by using the moving average). (d) Time-lapse two-photon fluorescence images of osteoclasts captured at 0–180 min. Original images, binarized images, and 3D surface plots of Red-pHocas and a3-GFP are shown from the top. In 3D surface plots, fluorescence intensities were indicated as heights. White lines indicate cell borders. (e) Schematic illustrations of proton pump dynamics and acidic regions in osteoclasts in parts b (top) and d (bottom), respectively. Dose: 10 mg/kg (3 days). Excited at 860 nm. Scale bars: 20 μm. Green, GFP-fused proton pumps; red, Red-pHocas; blue, bone tissue; yellow, acidic regions merged with proton pumps.

