
Figure 2.
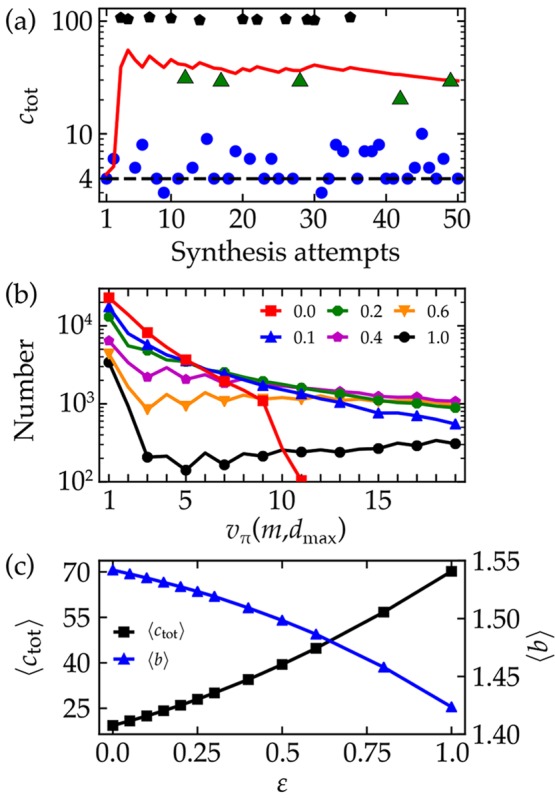
Heuristic policies. (a) Synthesis cost ctot for a single molecule m (N-dibutyl-4-acetylbenzeneacetamide) for successive iterations of the retrosynthesis game under the random policy. Blue circles denote “winning” synthesis plans that trace back to buyable molecules. Green triangles and black pentagons denote “losing” plans that exceed the maximum depth or include unmakeable molecules, respectively. The solid line shows the neural network prediction of the value function vπ(m, dmax) as it converges to the average synthesis cost. The dashed line shows the expected cost under the deterministic “symmetric disconnection” policy with γ = 1.5. (b) Distribution of expected costs vπ(m, dmax) over the set of 100 000 target molecules for different noise levels ε. The red squares and black circles show the performance of the symmetric disconnection policy (ε = 0) and the random policy (ε = 1), respectively. See Figure S1 for the full distribution including higher cost (“losing”) syntheses. (c) The average synthesis cost of the target molecules increases with increasing noise level ε, while the average branching factor decreases. Averages were estimated from 50 plays for each target molecule.