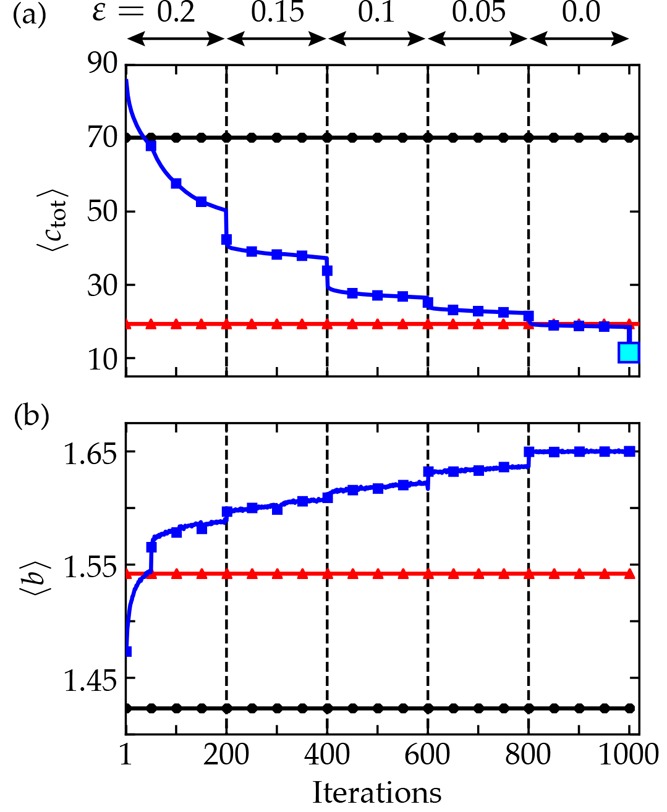
Figure 3.

Training results. (a, b) ⟨ctot⟩ and ⟨btot⟩ computed using π∗ are plotted versus policy iterations, respectively (solid blue squares). Solid horizontal lines show these quantities for the heuristic policy πsd (red triangles) and the random policy (black circles). The larger cyan square shows ⟨ctot⟩ after each tree had been searched for the best (lowest) target cost. Dashed vertical lines show points when ε was lowered.
