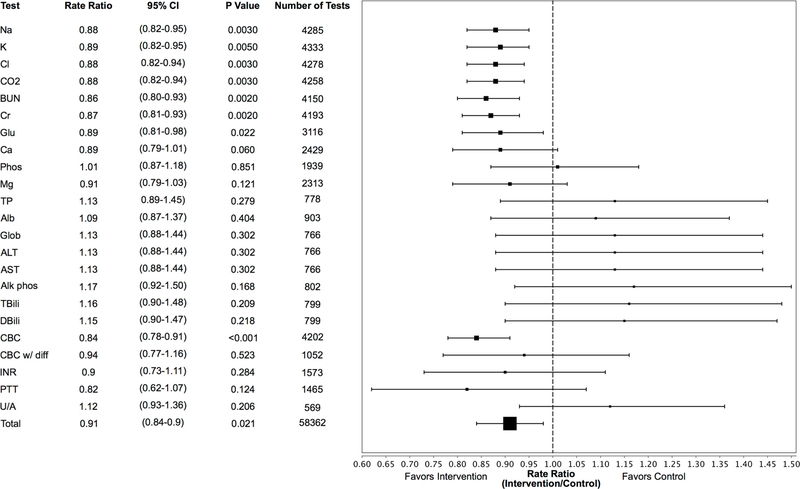
FIGURE 2.
Rate ratios of lab ordering by test
NOTE: Forest plot depicting rate ratios of lab ordering generated from Poisson (Ca, Mg, PTT) and negative binomial regressions. Abbreviations: Lower CL = lower limit of 95% confidence interval, Upper CL = upper limit of 95% confidence interval, individual laboratory test abbreviations per methods section.

