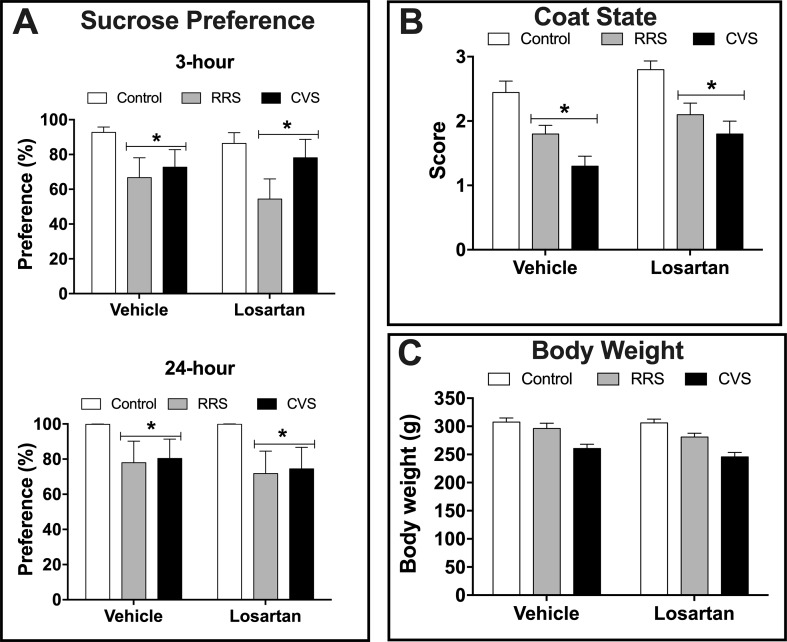
Figure 1.
Depressive-like state in animals treated with either vehicle or losartan control (white bars) and subjected to RRS (gray bars) or CVS (black bars). (A) Sucrose preference (%) evaluated during 3 and 24 h. *P < 0.05 versus respective control group, two-way ANOVA (n = 10/group). (B) Coat state score. *P < 0.05 versus respective control group, two-way ANOVA (n = 10/group). (C) Body weight at the 10th day of stress protocol. Two-way ANOVA (n = 10/group). The bars in all graphs represent the mean ± SEM.

