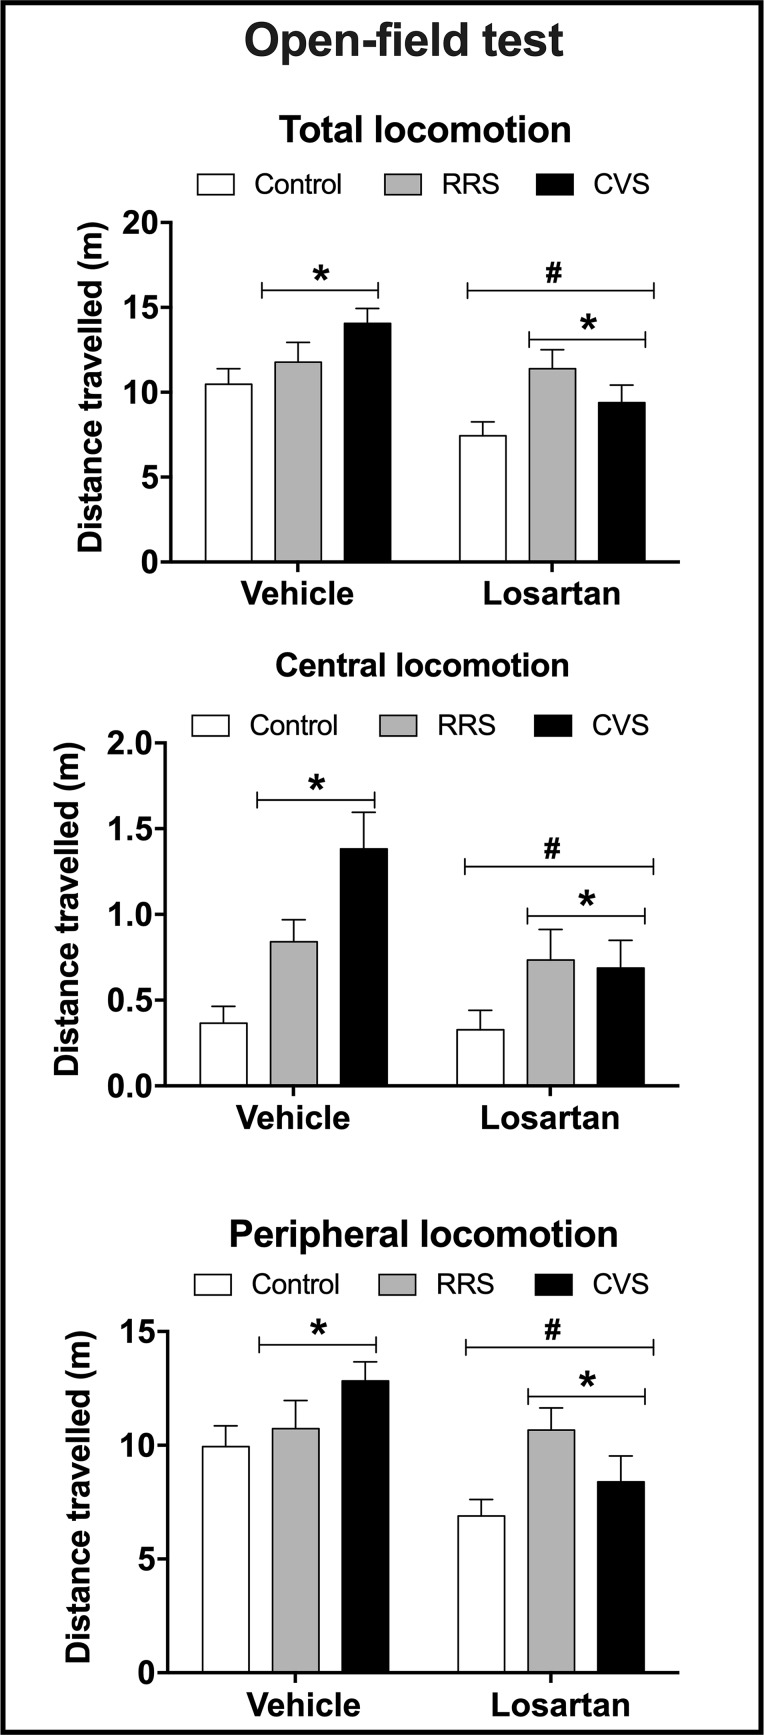
Figure 2.
Total locomotion (distance travelled in the periphery + center, top graph) and distance travelled in the center (central locomotion, middle graph) and periphery (peripheral locomotion, bottom graph) in the open field apparatus in animals treated with either vehicle or losartan control (white bars) and subjected to RRS (gray bars) or CVS (black bars). The bars represent the mean ± SEM. *P < 0.05 vs respective control group, #P < 0.05 vs respective vehicle groups. Two-way ANOVA followed by Bonferroni post-hoc test (n = 8–10/group).

