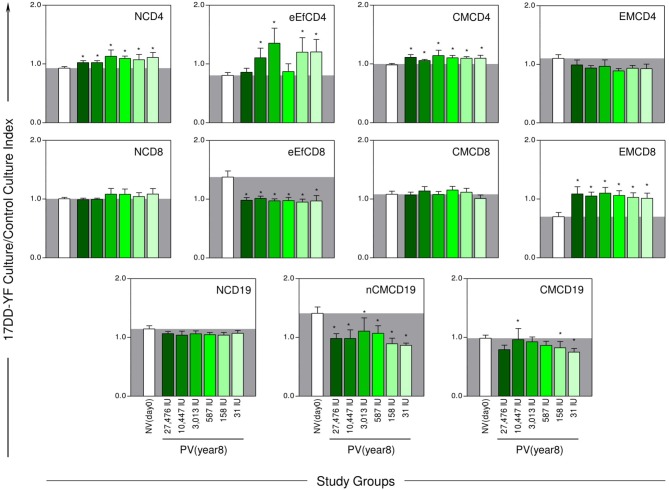
Figure 3.
YF-specific phenotypic memory biomarkers 8-years after 17DD-YF primary vaccination with different doses. The YF-specific phenotypic memory was measured based on cell-surface marker expression upon in vitro 17DD-YF antigen recall as described by Costa-Pereira et al. (22). Flow cytometric phenotypic analysis based on the expression of CD45RO and CD27 was used to define memory CD4+ and CD8+ T-cell subsets: Naïve/NCD4;NCD8—(CD27+CD45RO−); early Effector/eEfCD4;eEfCD8—(CD27−CD45RO−); Central Memory/CMCD4;CMCD8—(CD27+CD45RO+) and Effector Memory/EMCD4;EMCD8—(CD27−CD45RO+). The expression of IgD and CD27 was employed to define memory B-cell subsets: Naïve/NCD19—(CD27−IgD+); Non-classical Memory/nCMCD19—(CD27+IgD+) and Classical Memory/CMCD19—(CD27+IgD−). The eligible vaccinees (n = 98) were categorized into six subgroups, according to the dose of 17DD-YF vaccine administered in 2009: 27,476IU, considered the reference dose ( , n = 16); 10,447IU (
 , n = 17); 3,013IU (
 , n = 19); 587IU (
 , n = 17); 158IU (
 , n = 18), and 31IU (
 , n = 11). A group of non-vaccinated adult male army conscripts, referred as NV(day0), was included as a control (□, n = 46). The results are expressed mean values and standard error of 17DD-YF Ag/CC Index as described in Material and Methods. Comparative analysis for each biomarker amongst groups were assessed by ANOVA adjusted to multiple comparisons and significant differences at p < 0.05 highlighted by asterisk (*) as compared to the mean values observed for NV(day0). The gray zone represents the mean values observed for non-vaccinated controls.

