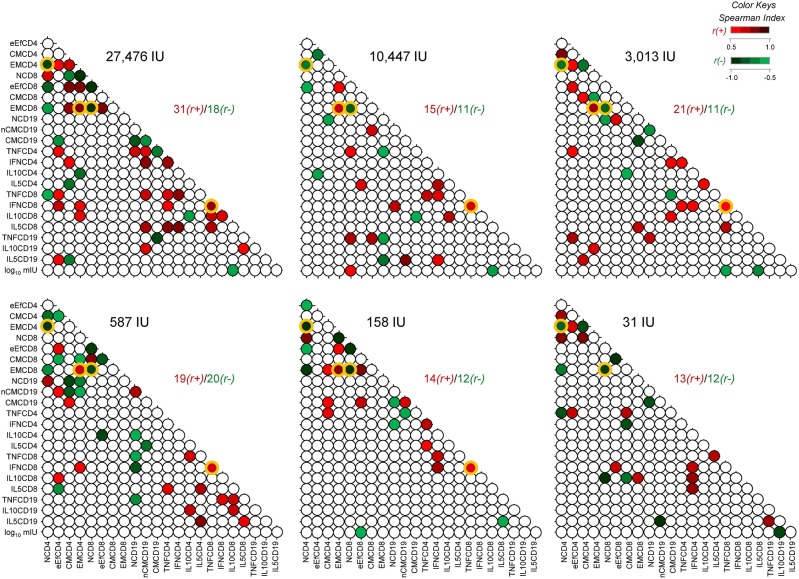
Figure 5.
Biomarker network matrices 8-years after 17DD-YF primary vaccination with different doses. The biomarker network of YF-specific humoral and cellular memory was built to define the connections between PRNT levels (log10 mIU/mL), phenotypic (NCD4, eEfCD4, CMCD4, EMCD4, NCD8, eEfCD8, CMCD8, EMCD8, NCD19, nCMCD19, and CMCD19) and functional memory attributes (TNFCD4, IFNCD4, IL10CD4, IL5CD4, TNFCD8, IFNCD8, IL10CD8, IL5CD8, TNFCD19, IL10CD19, and IL5CD19). Correlation analysis were carried out for six vaccinees groups, according to the dose of 17DD-YF vaccine administered in 2009: 27,476IU, considered the reference dose; 10,447IU; 3,013IU; 587IU; 158IU, and 31IU. Matrices were assembled in dotted template with each dot representing a correlation axis between two attributes. Color keys were employed to identify significant Spearman's correlation “r” indices at p < 0.05, referred as positive (red scale,  , r(+) ranging from 0.5 to 1.0) or negative (green scale,
  , r(-) ranging from −1.0 to −0.5). Non-significant correlations are represented by white dots. Ratio between positive and negative correlations “r(+)/r(-)” are provided in the Figure. The common correlations across distinct 17DD-YF vaccine doses are highlighted by orange frames.

