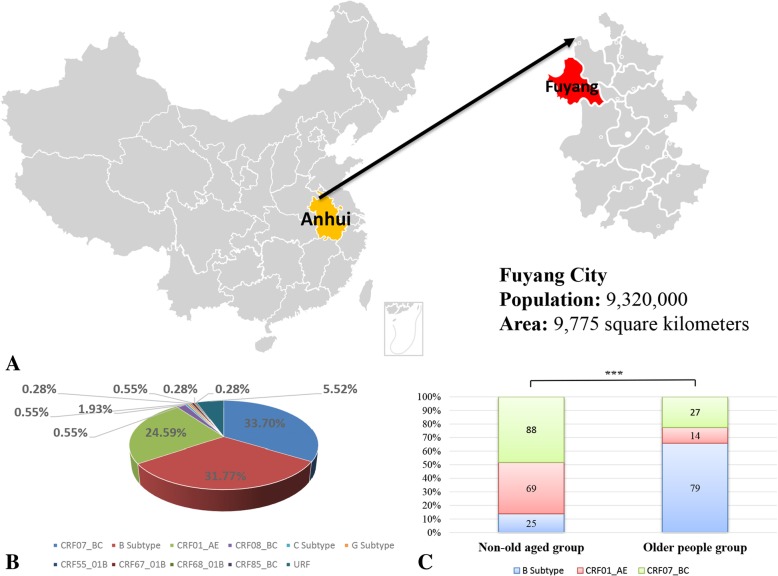
Fig. 1.
a. Map of China highlighting Fuyang, Anhui Province with the population and area labeled below. b. Pie chart in the lower-left corner representing the HIV-1 subtype distribution of the 362 newly diagnosed people, with available sequences from October 2017 to September 2018 in Fuyang. c. Differences in the constituent ratios of three major circulating subtypes (B subtype, CRF01_AE, and CRF07_BC) between the older people group and the non-old-aged group. “***” represents P < 0.001

