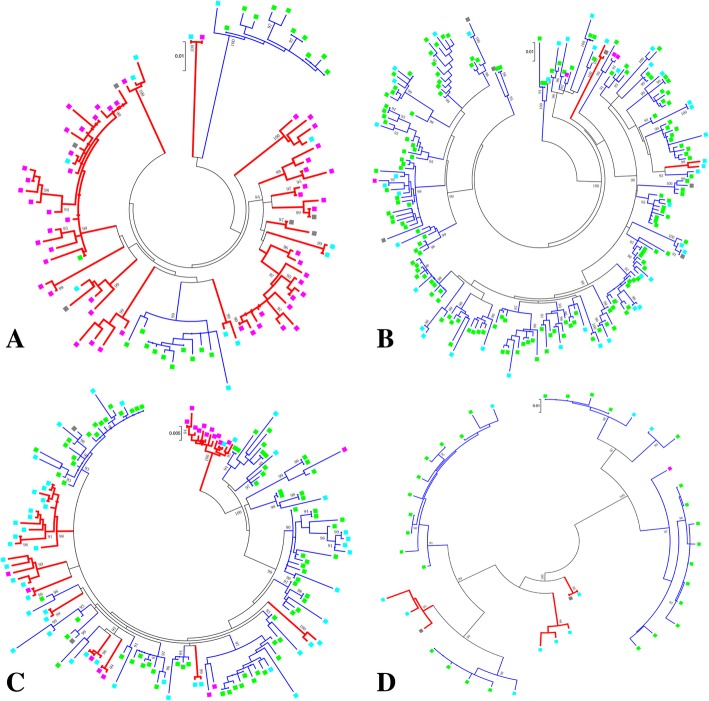
Fig. 2.
Transmission clusters in the maximum likelihood (ML) phylogenetic trees. A total of 86 transmission clusters consisting 485 sequences (n = 207 from Fuyang and n = 278 reference sequences) were identified by constructing the ML tree. The results are shown by subtype groups: a. B subtype, b. CRF01_AE, c. CRF07_BC and d. Other subtypes. The branch support (aLRT-SH) above 90% is shown at the corresponding nodes, and corresponding branch colors indicate cluster classifications (Red represents the local transmission cluster; Blue represents the non-local transmission cluster). Square colors indicate the sequences from different population subgroups (Pink: older people; Light blue: non-old-aged people; Light green: reference sequences; Grey: unknown-aged people)

