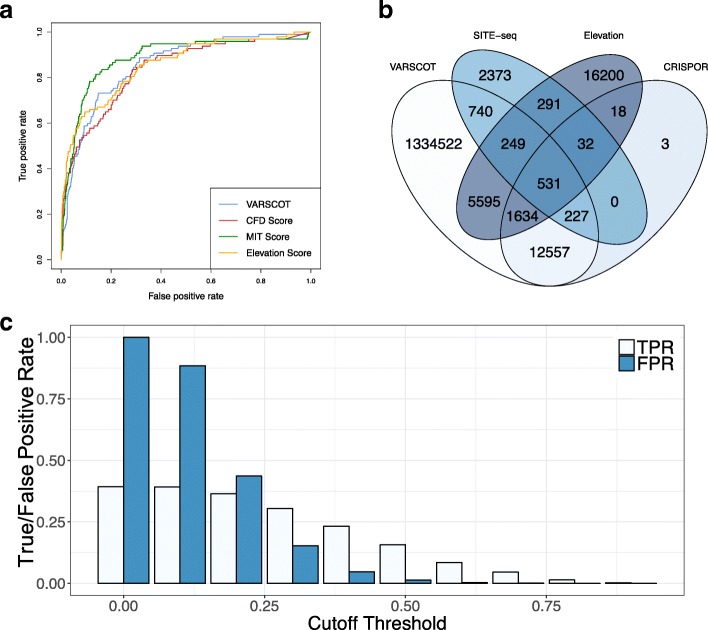
Fig. 2.
Comparison of the VARSCOT pipeline (a) Receiver Operating Characteristic (ROC) curves of VARSCOT and other off-target activity models tested on the Test Dataset. b Number of potential off-targets detected by the VARSCOT, Elevation and CRISPOR pipelines compared to the off-targets detected experimentally in the Test Dataset. c Effect of a threshold on the True Positive Rate (TPR) and False Positive Rate (FRP) of detection of VARSCOT

