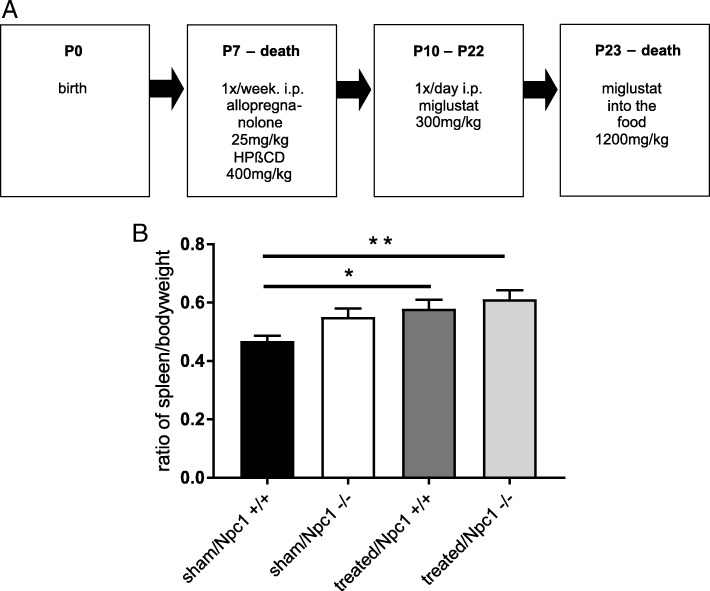
Fig. 1.
Scheme of the drug application for the treatment in Npc1+/+ and Npc1−/− mice (a). Evaluation of spleen-to-body-weight ratios (SW/BW) of sham-treated Npc1+/+ (n = 11), sham-treated Npc1−/− (n = 9), treated Npc1+/+ (n = 14), and treated Npc1−/− mice (n = 12, b). Note the increase of SW/BW ratio of treated Npc1+/+ and treated Npc1−/− mice. Values are given as mean ± SEM; ANOVA; multiple comparison tests: *p ≤ 0.05 sham-treated Npc1+/+ vs. treated Npc1+/+; **p ≤ 0.01 sham-treated Npc1+/+ vs. treated Npc1−/−

