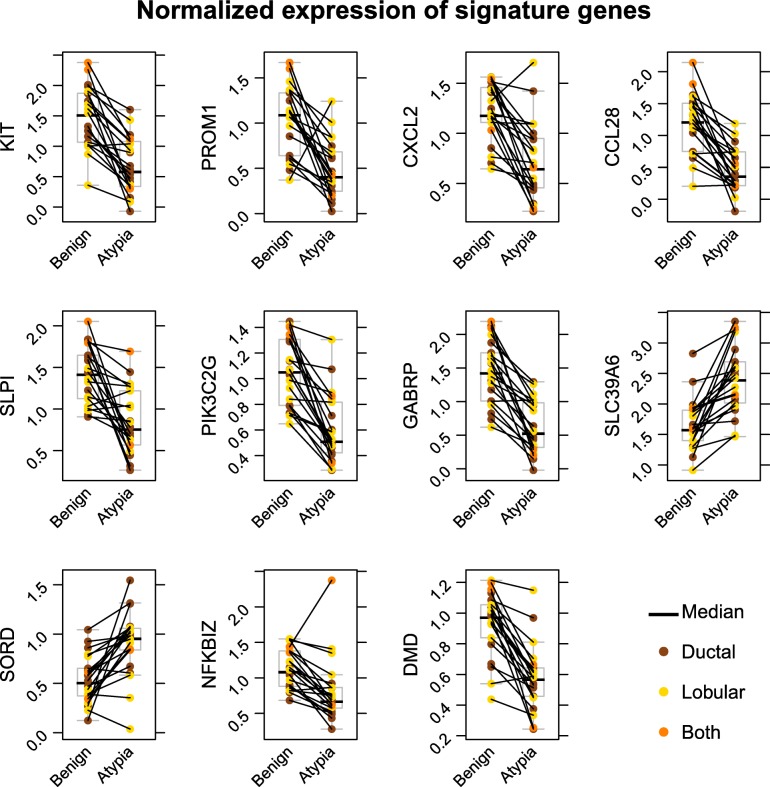
Fig. 4.
Differential expression of genes in histologically normal benign (HNB) and AH tissues. AGNES was used to select 99 genes that are most strongly associated with AH. The distribution of normalized expression is shown for each of the top 11 genes. The colors indicate the diagnosis of lesions as ductal, lobular, or containing both

