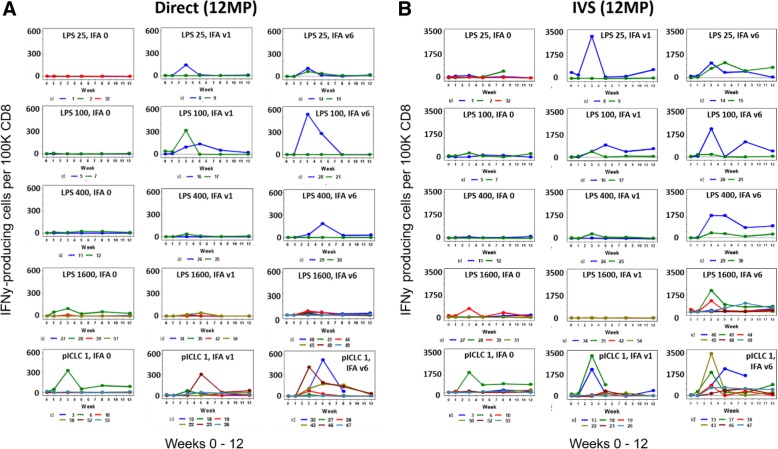
Fig. 2.
T cell responses over time (weeks 0–12). CD8 T cell responses to 12MP are shown for each patient from direct ELIspot assays (a), and from IVS ELIspot assays (b). Direct assay data represent response to pooled 12MP; IVS ELIspot data represent sum of responses to each of the 12 individual peptides. Response magnitude is shown as the number of IFNγ-secreting cells, less negative controls, per 100,000 CD8 cells. Values are shown as zero if they did not meet criteria for positivity

