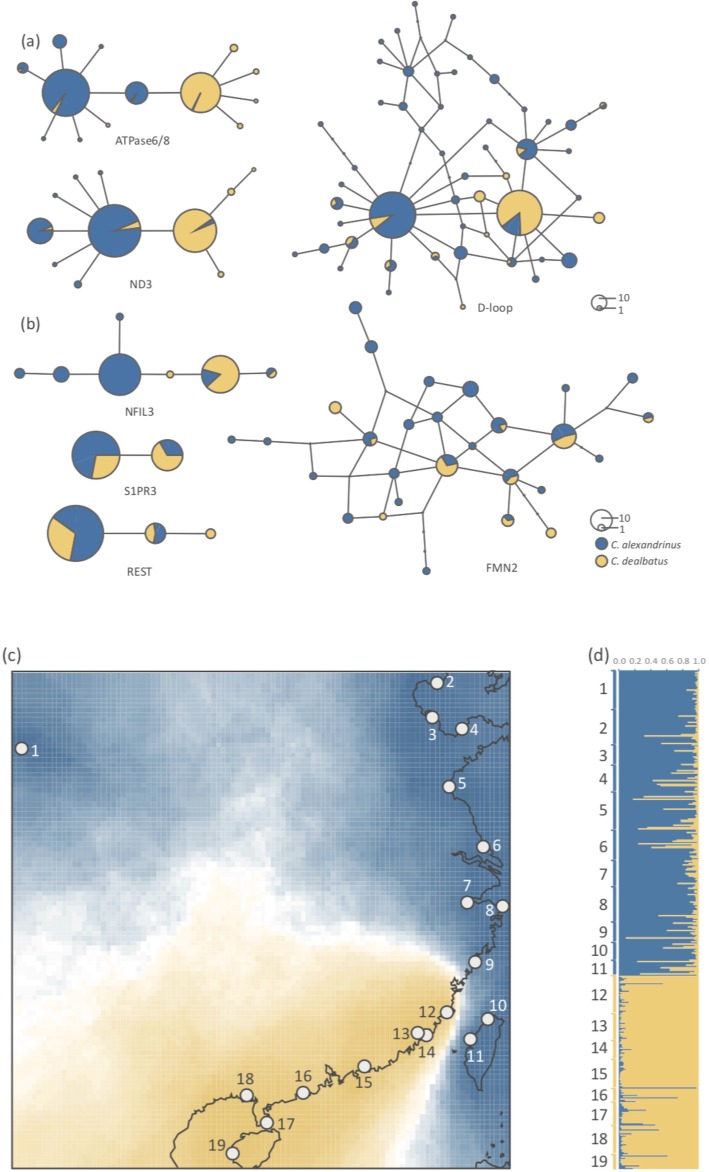
Fig. 2.
Haplotype networks based on mitochondrial and nuclear DNA sequences, and population genetic structures based on microsatellite loci. C. alexandrinus is marked in blue and C. dealbatus in yellow. a Haplotype networks of three mitochondrial loci. For ATPase6/8 and ND3, over 95% of the individuals are sorted into two major haplogroups. b Examples of haplotype networks based on four exonic nuclear loci (NFIL3 and S1PR3 are Z-linked loci) of 55 to 80 individuals. c Genetic clustering inferred from microsatellite genotypes using Geneland. Blue and yellow bars show the assignment probability of a location for alternative genetic clusters. Location numbers are consistent with Fig. 1. d Genetic clustering inferred from microsatellites using STRUCTURE. Map source: National Geomatics Center of China (http://www.ngcc.cn)

