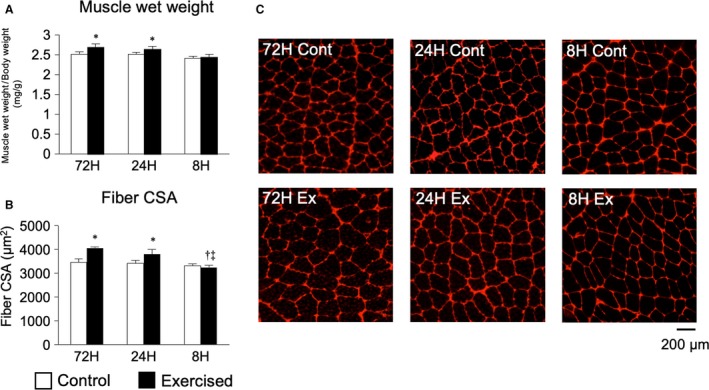
Figure 2.

Changes in muscle‐hypertrophic effects according to the duration of recovery. Muscle wet weights (A), fiber CSAs (B), and anti‐laminin immunofluorescence staining of muscle sections (C). Data are presented as the mean + SE. *P < 0.05 versus control in each group, † P < 0.05 versus ipsilateral muscle in 72‐h recovery group, ‡ P < 0.05 versus ipsilateral muscle in 24‐h recovery group.
