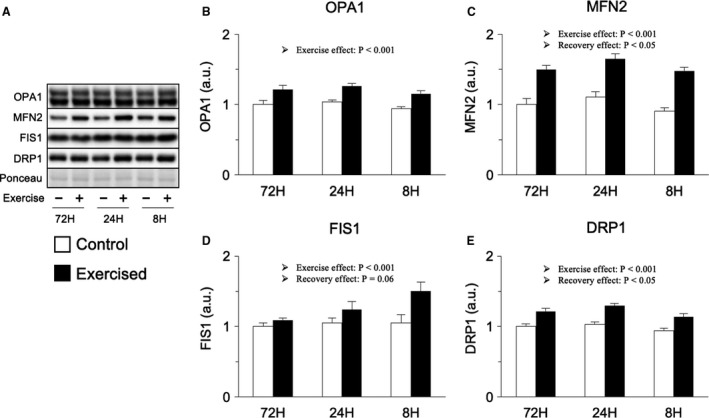
Figure 7.

Protein expression involved in mitochondrial dynamics. Representative bands (A), protein expression of OPA1 (B), MFN2 (C), FIS1 (D), and DRP1 (F). Data are expressed relative to the no exercise 72‐h group and presented as the mean + SE. *P < 0.05 versus control in each group, † P < 0.05 versus ipsilateral muscle in 72‐h group, ‡ P < 0.05 versus ipsilateral muscle in 24‐h group.
