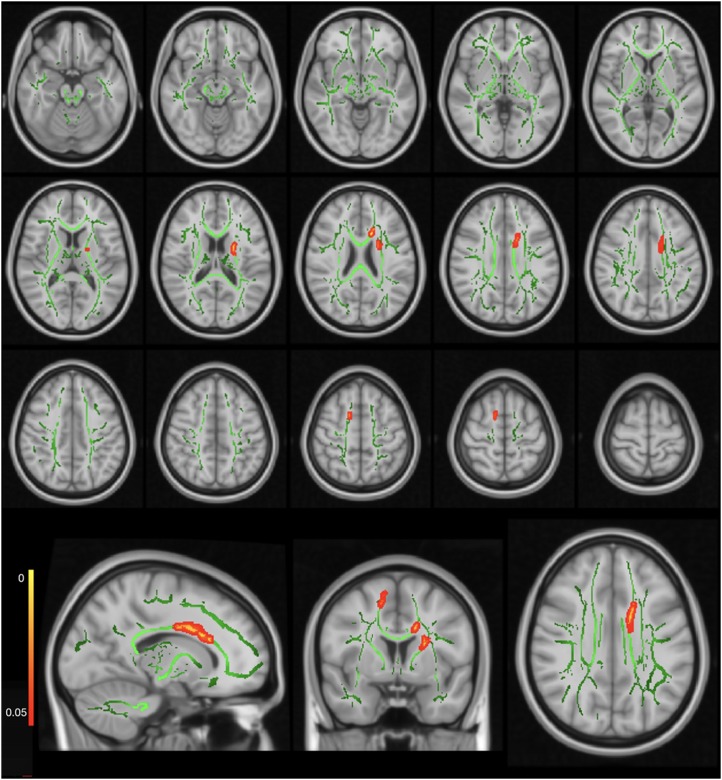
FIGURE 1.
Axial diffusivity (AD) map showing significantly higher AD values in the CSHNL group as compared to the control group. The red–yellow highlighted areas indicate higher AD values in the right corticospinal tract, left anterior thalamic radiation, and left corpus callosum. The background image consists of the standard MNI T1-weighted template at 1-mm thickness and the FA skeleton (green). The images at the bottom row from the left side to the right side indicate sagittal, coronal, and axial images for one representative axial level.

