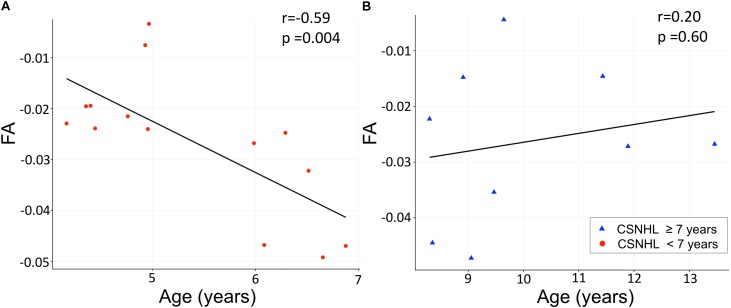
FIGURE 5.
Correlation analysis between the mean FA values and age. The mean FA values on the Y-axis indicate the differences between the Heschl’s gyrus (HG) and the forceps major (FM). (A) Correlation between the mean FA values and age in the CSNHL group < 7 years of age. (B) Correlation between the mean FA values and age in the CSNHL group ≥ 7 years of age.

