
Fig. 4.
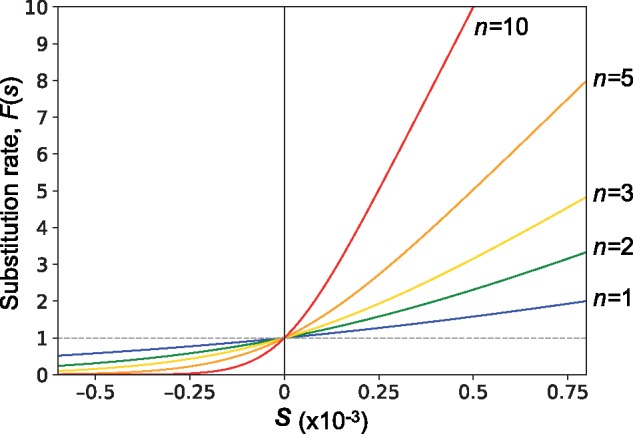
—The substitution rate (F(s)) as a function of s, the selection coefficient that a single mutation confers. N = 1,000 was assumed for computing F(s). F(s) is standardized such that .
Official websites use .gov
A
.gov website belongs to an official
government organization in the United States.
Secure .gov websites use HTTPS
A lock (
) or https:// means you've safely
connected to the .gov website. Share sensitive
information only on official, secure websites.
—The substitution rate (F(s)) as a function of s, the selection coefficient that a single mutation confers. N = 1,000 was assumed for computing F(s). F(s) is standardized such that .