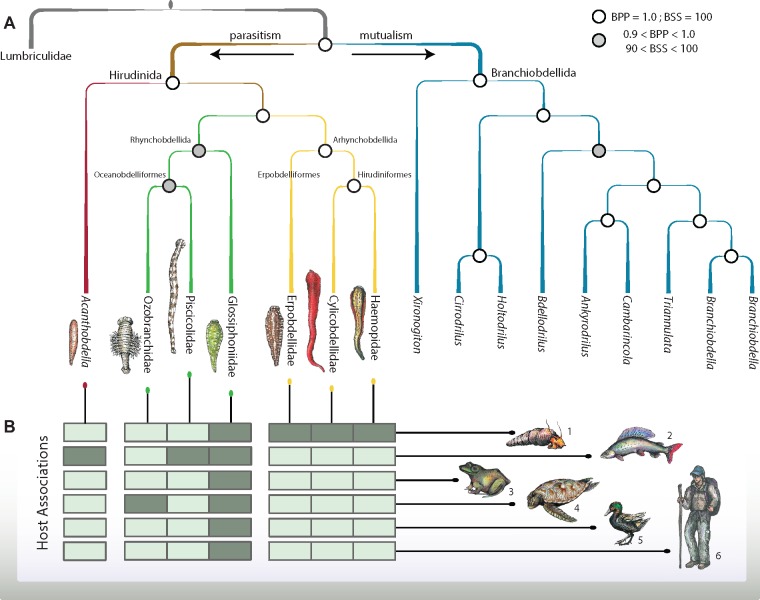
Fig. 2.
—Phylogenetic relationships of major leech and branchiobdellidan lineages and host associations. (A) Evolutionary relationships based on Bayesian and maximum likelihood analyses of DNA sequence data captured through anchored hybrid enrichment. Clade support values are indicated by circles at nodes (Bayesian posterior probability = BPP; Bootstrap support = BSS). Branches are color-coded to show historically accepted higher taxa: brown = Hirudinida, green = Rhynchobdellida (now Oceanobdelliformes and Glossiphoniiformes), yellow = Arhynchobdellida (represented in this study by members of what are now Erpobdelliformes and Hirudiniformes), red = Acanthobdellida, blue = Branchiobdellida. (B) Matrix indicates associations of leeches (columns aligned to phylogeny) with generalized hosts (rows) depicted graphically as 1) invertebrates, 2) fishes (marine, brackish, and freshwater), 3) amphibians and reptiles except turtles, 4) turtles (both marine and freshwater), 5) birds, and 6) mammals. Dark shaded cells in the matrix indicate leech-host affiliation. Upward lines stemming from the matrix link the matrix in A with dots color coded by respective branches, horizontal lines correspond with generalized hosts.

