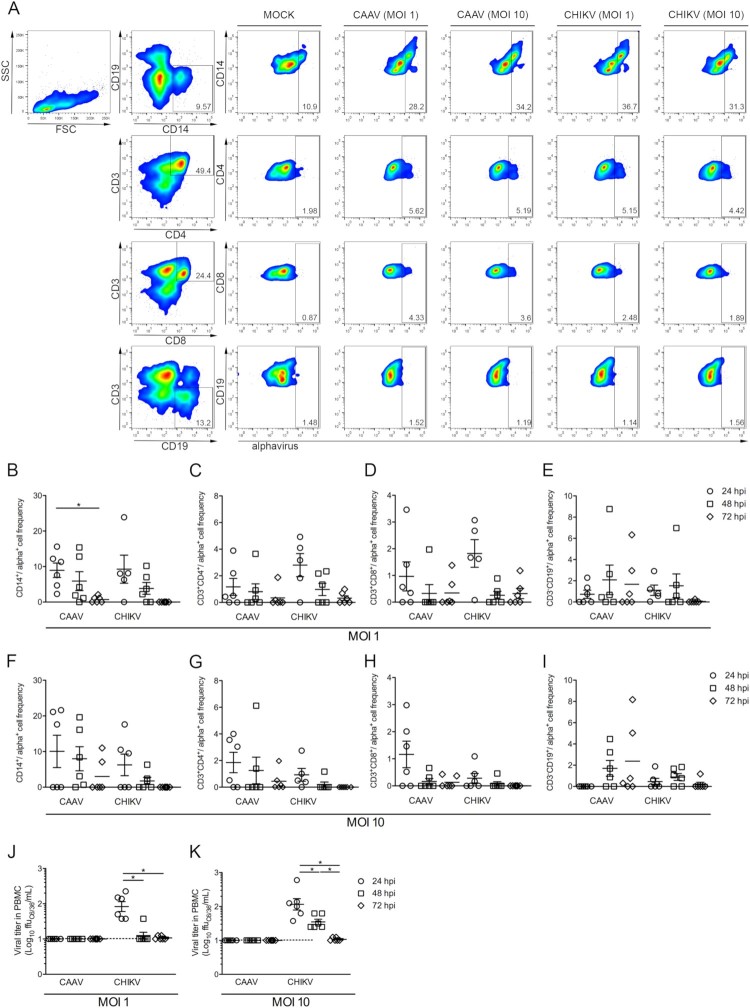
Figure 5.
Infection of human mononuclear cells with CAAV. PBMCs from six healthy donors were infected with CAAV or CHIKV at an MOI of 1 or 10, and cells were analysed a 24, 48, and 72 h postinfection (h.p.i). (A) Representative flow cytometry density plot data showing the results for CD3−CD14+ (monocytes), CD3+CD4+ and CD3+CD8+ (T lymphocytes), and CD3−CD19+ (B lymphocytes) for Mock and infected (anti-alphavirus) cells 24 h.p.i. Bars represent the average frequencies of infection. Normalized infection frequency was expressed after subtracting the autofluorescence signal from mock samples. (B and F) CD3−CD14+ frequency of infection, (C and G) CD3+CD4+ frequency of infection, (D and H) CD3+CD8+ frequency of infection, (E and I) CD3−CD19+ frequency of infection. Viral particles were quantified in the PBMC supernatant using a focus-forming assay in C6/36 cells (ffu/mL). (J) Viral titres in PBMCs infected with virus at an MOI of 1, (K) viral titres in PBMCs infected with virus at an MOI of 10. *P ≤ .05.

