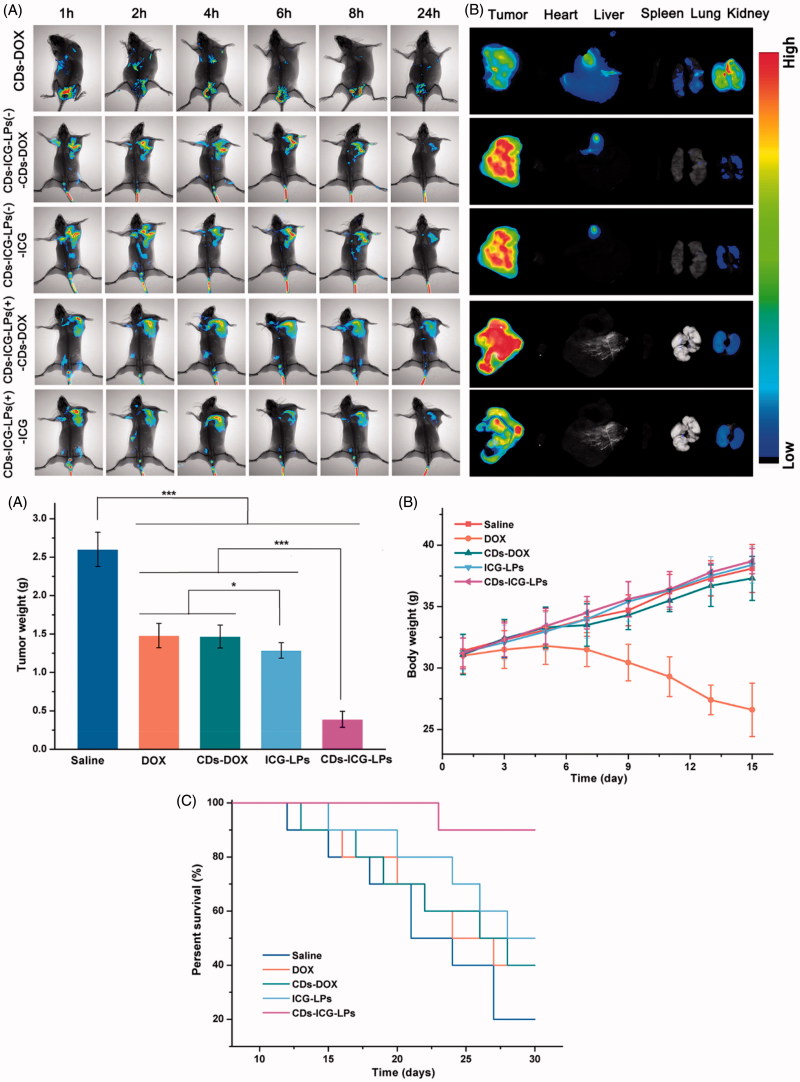
Figure 4.
In vivo imaging of CDs-ICG-LPs compared with CDs-DOX as controls delivered systemically via tail vein injections in mice implanted with H22 cell. (A) CDs-DOX, CDs-ICG-LPs in vivo images taken at 1, 2, 4, 6, 8, and 24 h time point (‘–’ and ‘+’ mean treated with/without laser irradiation). (B) Fluorescence images of organs and tumors in tumor-bearing mice after 24 h post-injection of CDs-DOX or CDs-ICG-LPs. The mean tumor weight (C), mice body weight (D), and survival time (E) of mice bearing H22 tumor treated with free DOX, CDs-DOX, ICG-LPs, CDs-ICG-LPs and mice given saline as a control in different groups.

