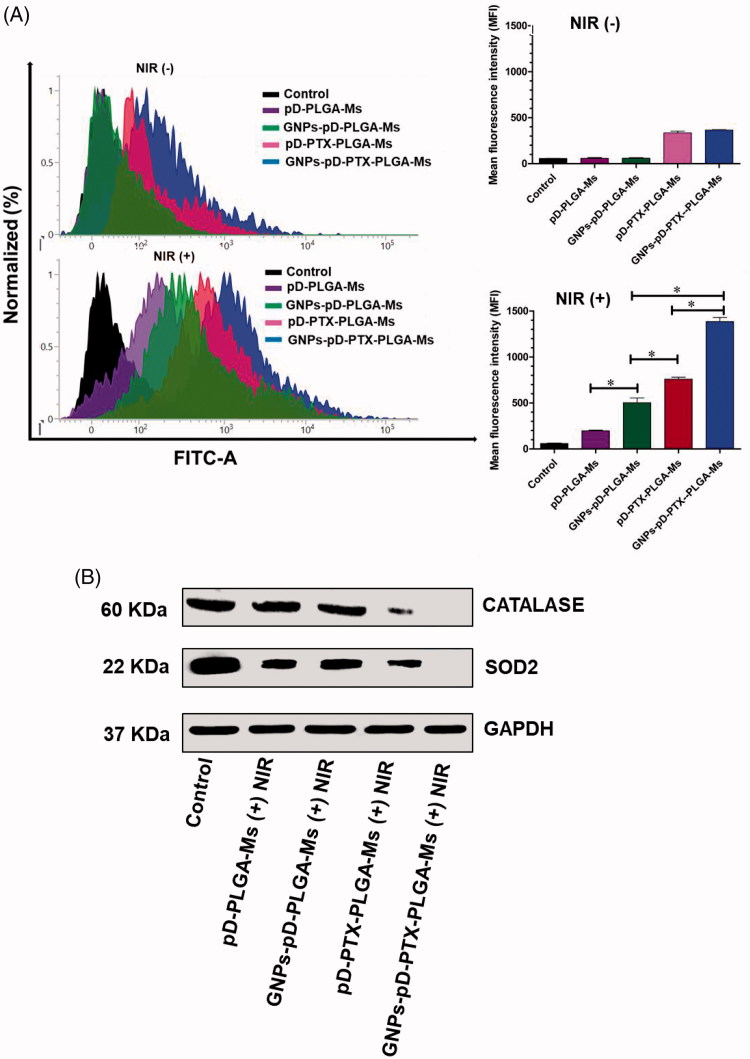
Figure 6.
(A) Total ROS production after treatment with GNPs-pD-PTX-PLGA-Ms in Panc-1 cells, followed by the treatment with 808 nm NIR laser (2.0 W/cm2) for 3 min and their relative mean fluorescence intensity. (B) Western blot analysis of protein expression in Panc-1 cells, following treatment with 808 nm NIR laser at a power density of 2.0 W/cm2 for 3 min.

