. 2019 May 22;10(25):6295–6303. doi: 10.1039/c9sc01937e

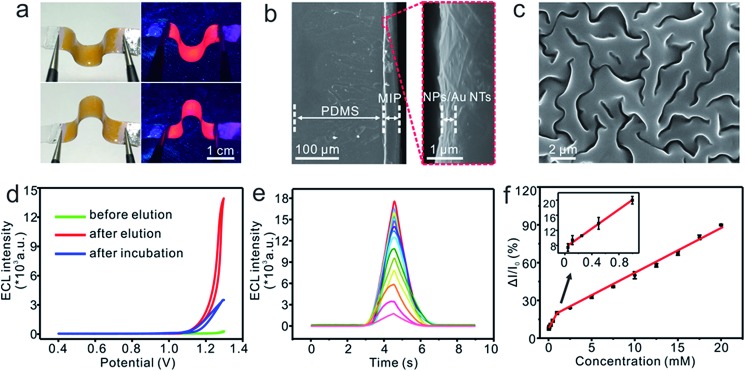
Fig. 3. (a) Acquired optical photographs of the bending characteristics of the flexible MIP-ECL sensor exposed to natural light or ultraviolet-light irradiation (λ = 365 nm). (b, c) SEM micrographs of the (b) cross-sectional structure and (c) surface morphology of the flexible MIP-ECL sensor after cyclic bending. (d) ECL signals of MIP/HLNs/Au NTs in 600 μL 0.1 M PBS (pH 7.4) before elution (green), after elution (red), and then during rebinding (blue). (e) ECL response for increasing concentrations of lactate from top to bottom, including concentrations of 0.05, 0.1, 0.25, 0.5, 1, 2.5, 5, 7.5, 10, 12.5, 15, 17.5, and 20 mM. (f) Calibration plot for determining lactate concentration.

Fig. 3