Figure 4.

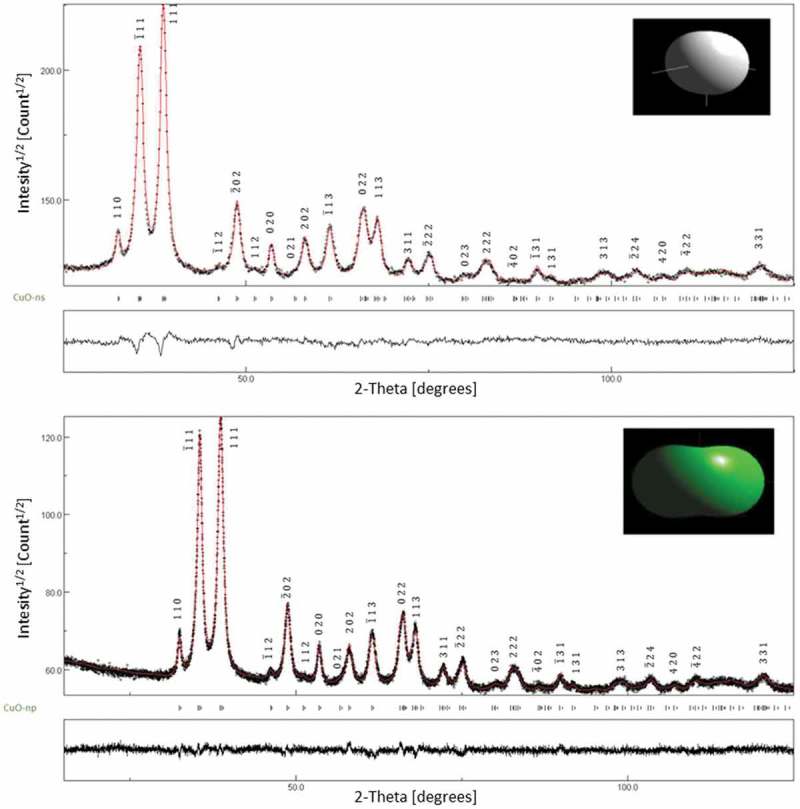
Diffractograms of CuO-ns and CuO-np samples. (◉) XRD data, (–) Rietveld refinement fit and Bragg position peaks. Insets show the mean shape of the structures.

Diffractograms of CuO-ns and CuO-np samples. (◉) XRD data, (–) Rietveld refinement fit and Bragg position peaks. Insets show the mean shape of the structures.