Figure 14.

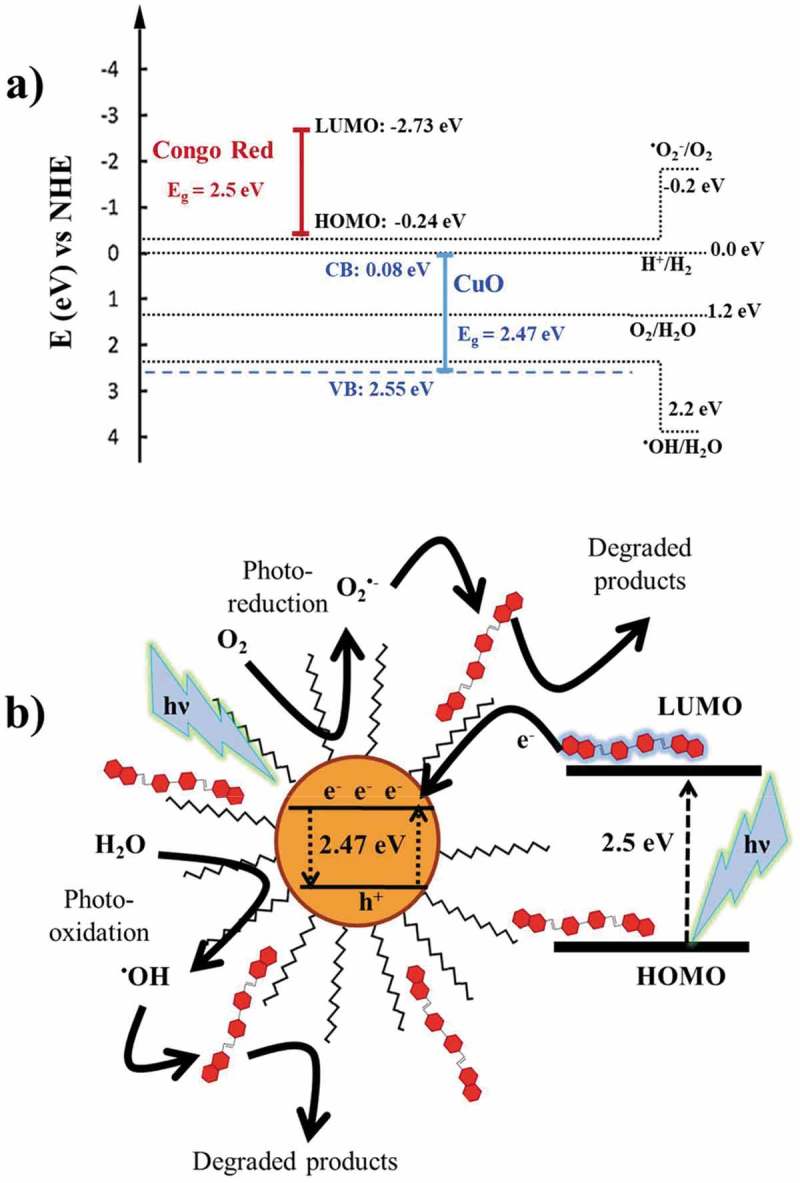
(a) Schematic diagram showing energy levels involved in the Congo Red photocatalytic degradation with CuO-np-C18; b) Graphical representation of radical species and charge transfer in the photocatalytic process.

(a) Schematic diagram showing energy levels involved in the Congo Red photocatalytic degradation with CuO-np-C18; b) Graphical representation of radical species and charge transfer in the photocatalytic process.