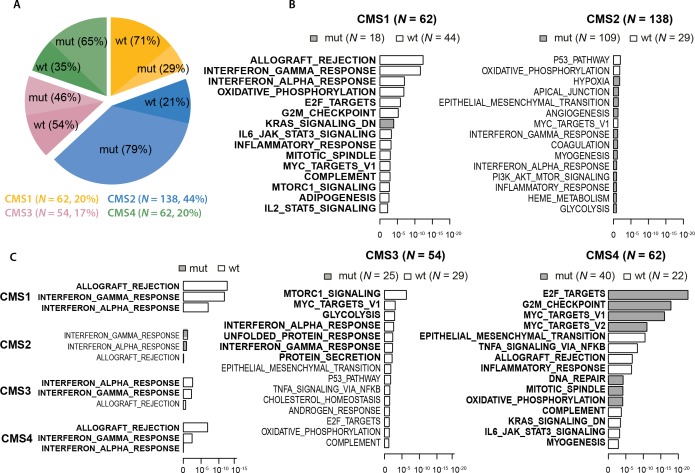
Figure 1.
TP53 mut rates and their transcriptional and immunomodulatory effects according to the CMSs. (A) The distribution of CMS groups and their TP53 mut rates in the Oslo series (N=316 CMS-classified samples). Numbers to the right refer to the amount and proportion of tumours in each CMS group. (B) Gene set analysis of 50 ‘hallmark gene sets' between TP53 wt and mut tumours within the individual CMS groups. The 15 most differentially expressed gene sets in each CMS group are shown, ranked by unadjusted p values (x-axes, log10 scale). Grey and white indicate gene sets with upregulation in TP53 mutated and wt samples, respectively. Significantly differentially expressed gene sets (FDR values <0.05) are highlighted in bold. (C) Significance levels (x-axis) from expression enrichment analysis of gene sets reflecting T cell activity between TP53 wt and mutated tumours according to CMS group. Analysis was performed on 316 CMS-classified samples in the Oslo series. CMS, consensus molecular subtype; FDR, False Discovery Rate; IL, interleukin; mut, mutation; wt, wild type.

