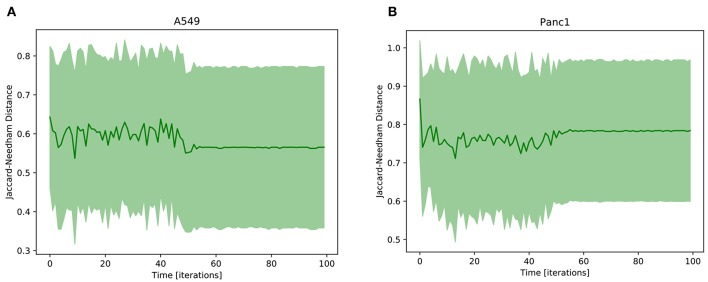
Figure 5.
Average Jaccard-Needham distance between the 10% most expressed phenotypes and the theoretical mesenchymal state (Table 3). The error bars represent the standard error. In (A) the results of A549 cells are reported, while (B) shows the Panc1 data.

