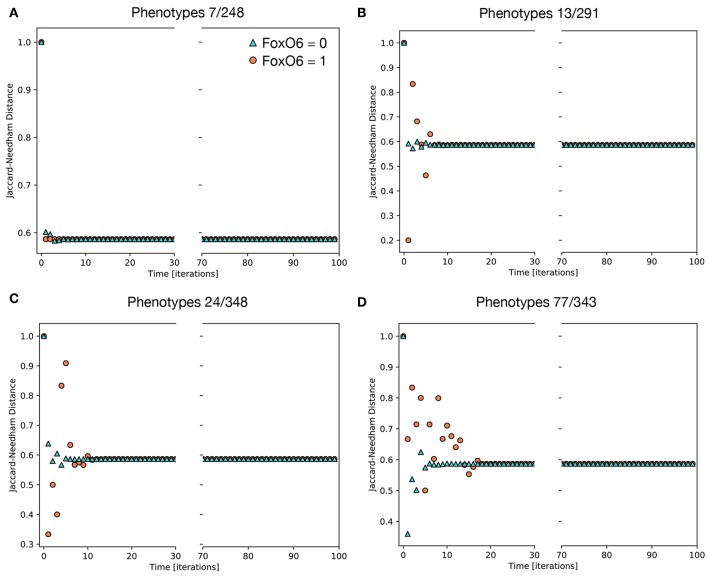
Figure 6.
Average Jaccard-Needham distance between the theoretical mesenchymal state and the populations generated through the simulations of single phenotypes. The eight initial configurations associated with the largest variation of this parameter are shown and divided in 4 couples differing only for the value of FOXO6 (Table 3). The traces in (A) describe the behavior of the first couple, phenotypes 7 and 248, while (B–D) refer to couples 2, 3, and 4, respectively. In all cases cyan triangles indicate the results obtained in absence of FOXO6, while the orange circles represent the condition of active FOXO6.

