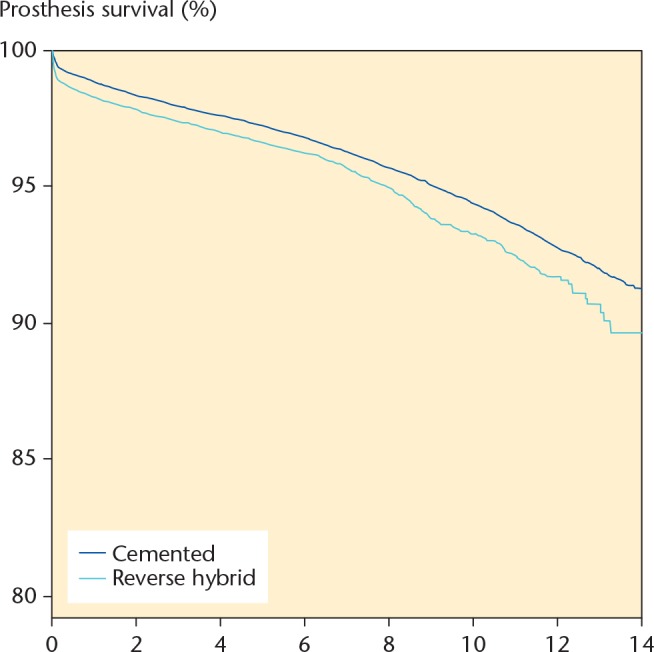
Fig. 5.

Cox survival analysis with adjustment for age, sex, time period, and diagnosis, and with any revision of the implant as endpoint. RR = 1.4 (CI: 1.3 to 1.5; p < 0.001).

Cox survival analysis with adjustment for age, sex, time period, and diagnosis, and with any revision of the implant as endpoint. RR = 1.4 (CI: 1.3 to 1.5; p < 0.001).