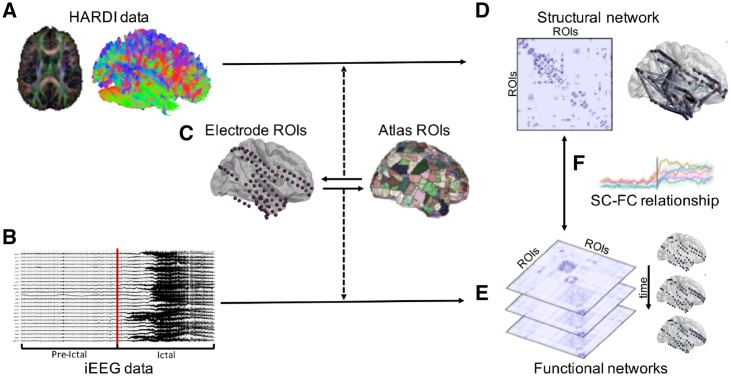
Figure 1.
Summary of patient-level SC-FC analysis pipeline. (A) HARDI preprocessing and whole-brain tractography was carried out. (B) iEEG data were preprocessed and seizures were annotated, with each seizure event consisting of an ictal period and an associated pre-ictal period of equivalent duration. (C) Regions of interest (ROIs) were selected via a one-to-one spatial correspondence between electrode centroids and atlas regions. (D) The structural connectivity (SC) network was generated using log-normalized streamline counts between atlas regions of interest associated with each electrode location. (E) Time-varying broadband functional connectivity (FC) networks were generated for each 1 s time window by computing correlation between iEEG signals across electrode pairs. Frequency-specific functional connectivity networks were similarly computed using coherence between iEEG signals across electrode pairs. (F) SC-FC relationships were quantified across time, frequency, and space (see ‘Materials and methods’ section for details).

